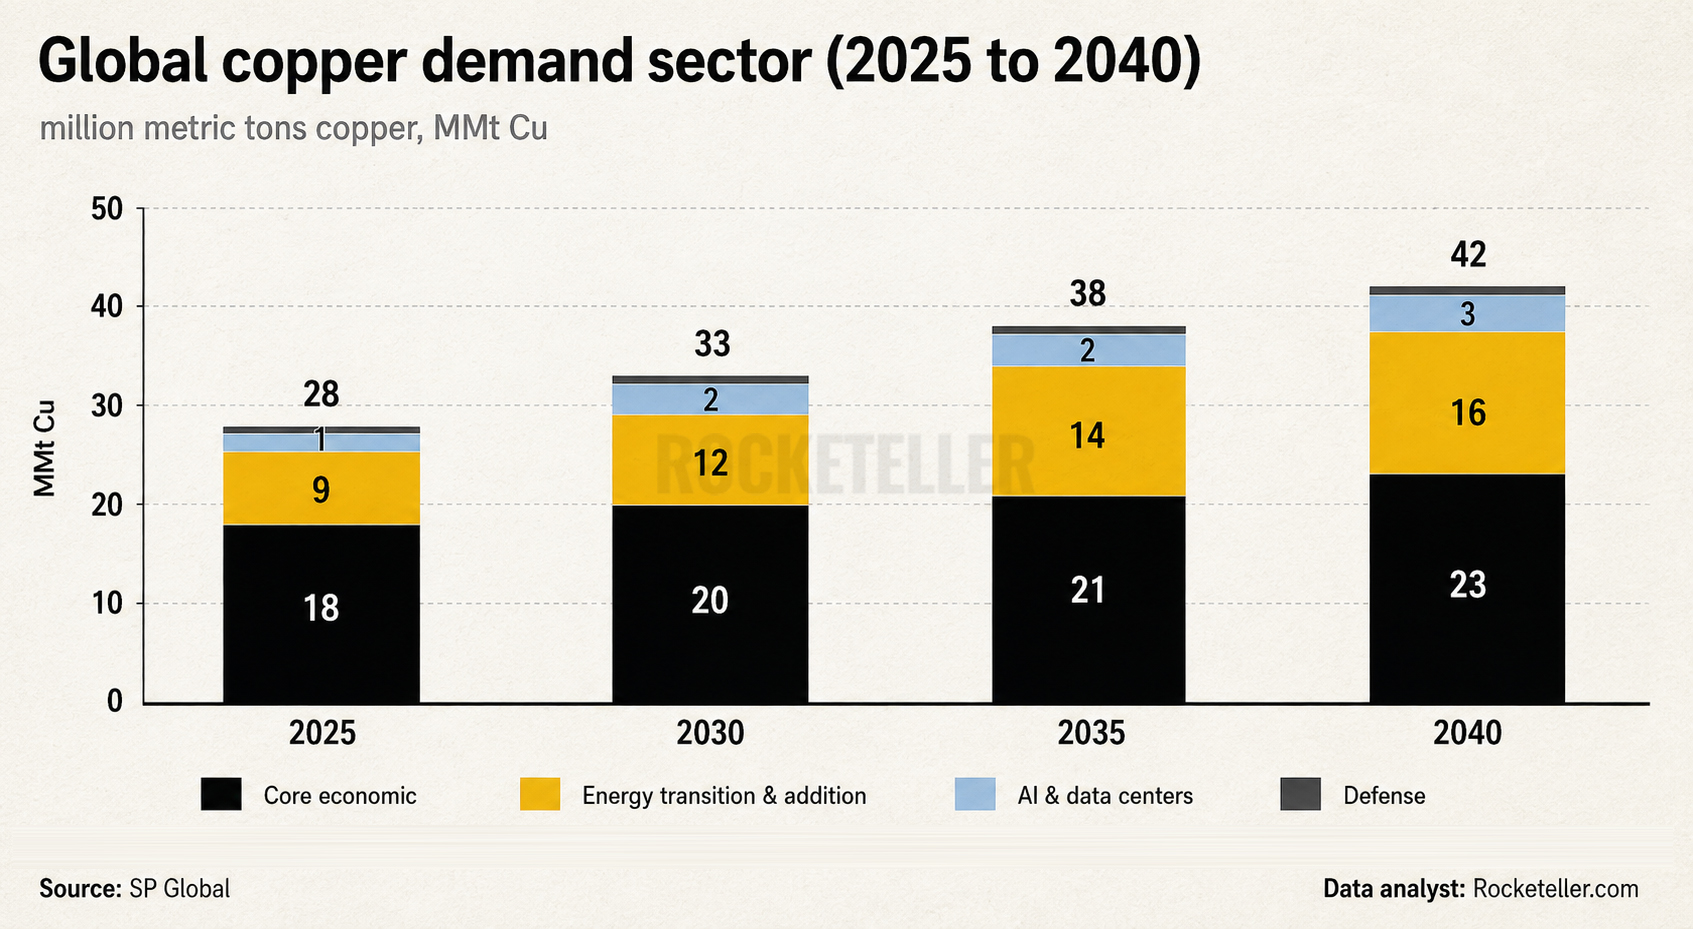
Copper is quietly becoming one of the most important pressure points in the global commodity story. This chart shows global copper demand rising from 28 million metric tons in 2025 to 42 million metric tons by 2040. That is roughly 50 percent growth in fifteen years, but the more interesting story is where that demand is coming from.
Traditional economic activity remains the heavyweight. Construction, manufacturing, electrical equipment and infrastructure keep core demand climbing from 18 to 23 million tons. But the real accelerator is the energy transition. Grid expansion, electric vehicles, renewable power, battery infrastructure and electrification push this category from 9 million tons in 2025 to 16 million tons by 2040.
Then comes the new kid with an enormous electricity bill. AI and data centers rise from around 1 million tons to 3 million tons. That may look small beside traditional demand, but data centers require power generation, transmission, transformers, cooling systems and huge amounts of electrical infrastructure. Copper sits somewhere inside almost all of it.
For commodity markets, the cause and effect is straightforward. Demand is becoming more structural while new mine supply remains slow, expensive and difficult to develop. Copper mines can take many years to move from discovery to production. If supply growth cannot keep pace, inventories tighten first. Then treatment charges, physical premiums and eventually copper prices begin reacting.
And copper rarely moves alone. Higher copper prices improve margins for quality miners, encourage exploration spending and raise the value of undeveloped deposits. They can also signal stronger capital spending across metals such as silver, aluminum and other electrification commodities.