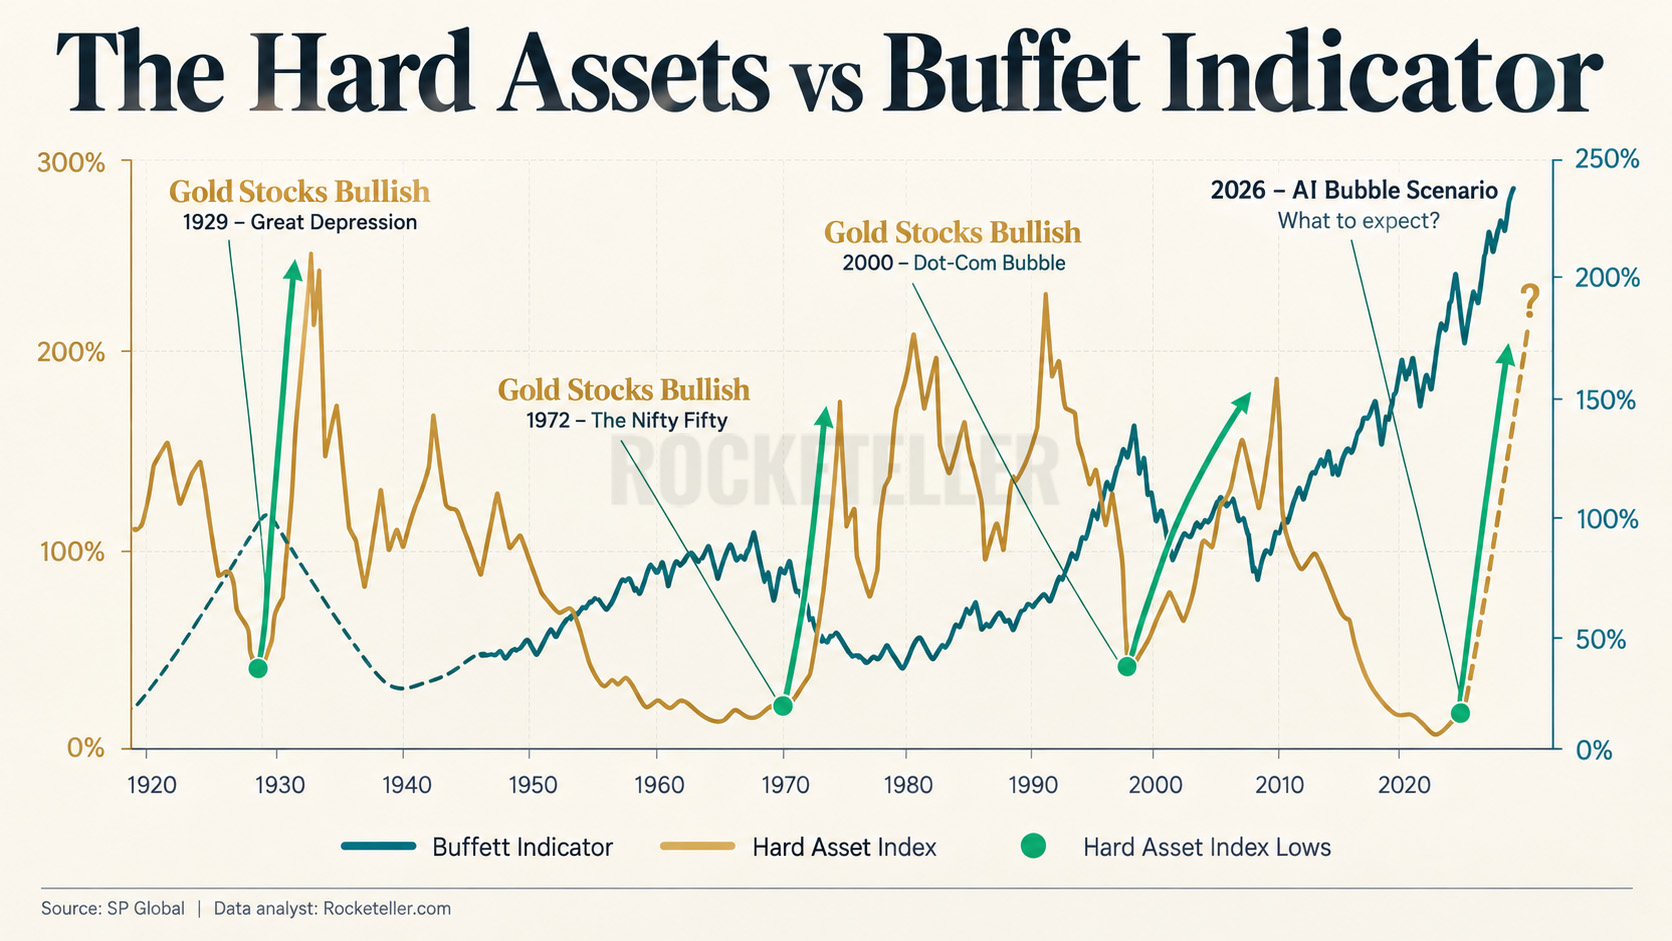
The 1929, 1972 and 2000 Buffett Indicator Pattern That Could Repeat in 2026
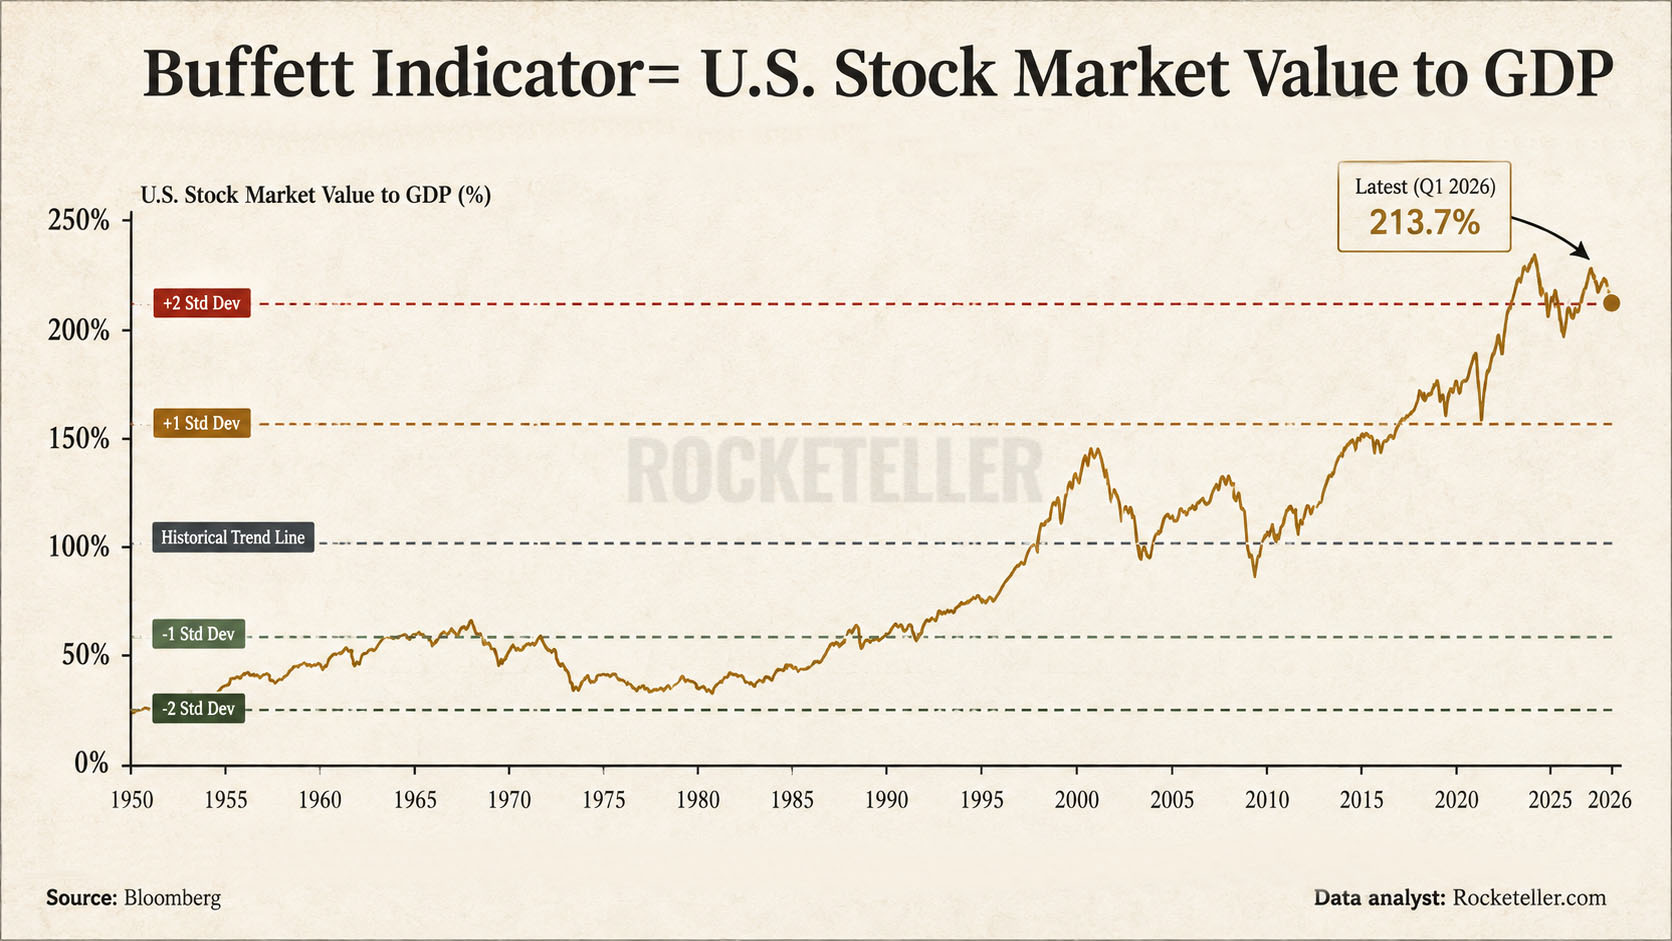
Every market cycle has a favorite investment. The trouble begins when everyone wants to own the same thing at the same price. This chart compares the Buffett Indicator, which measures the value