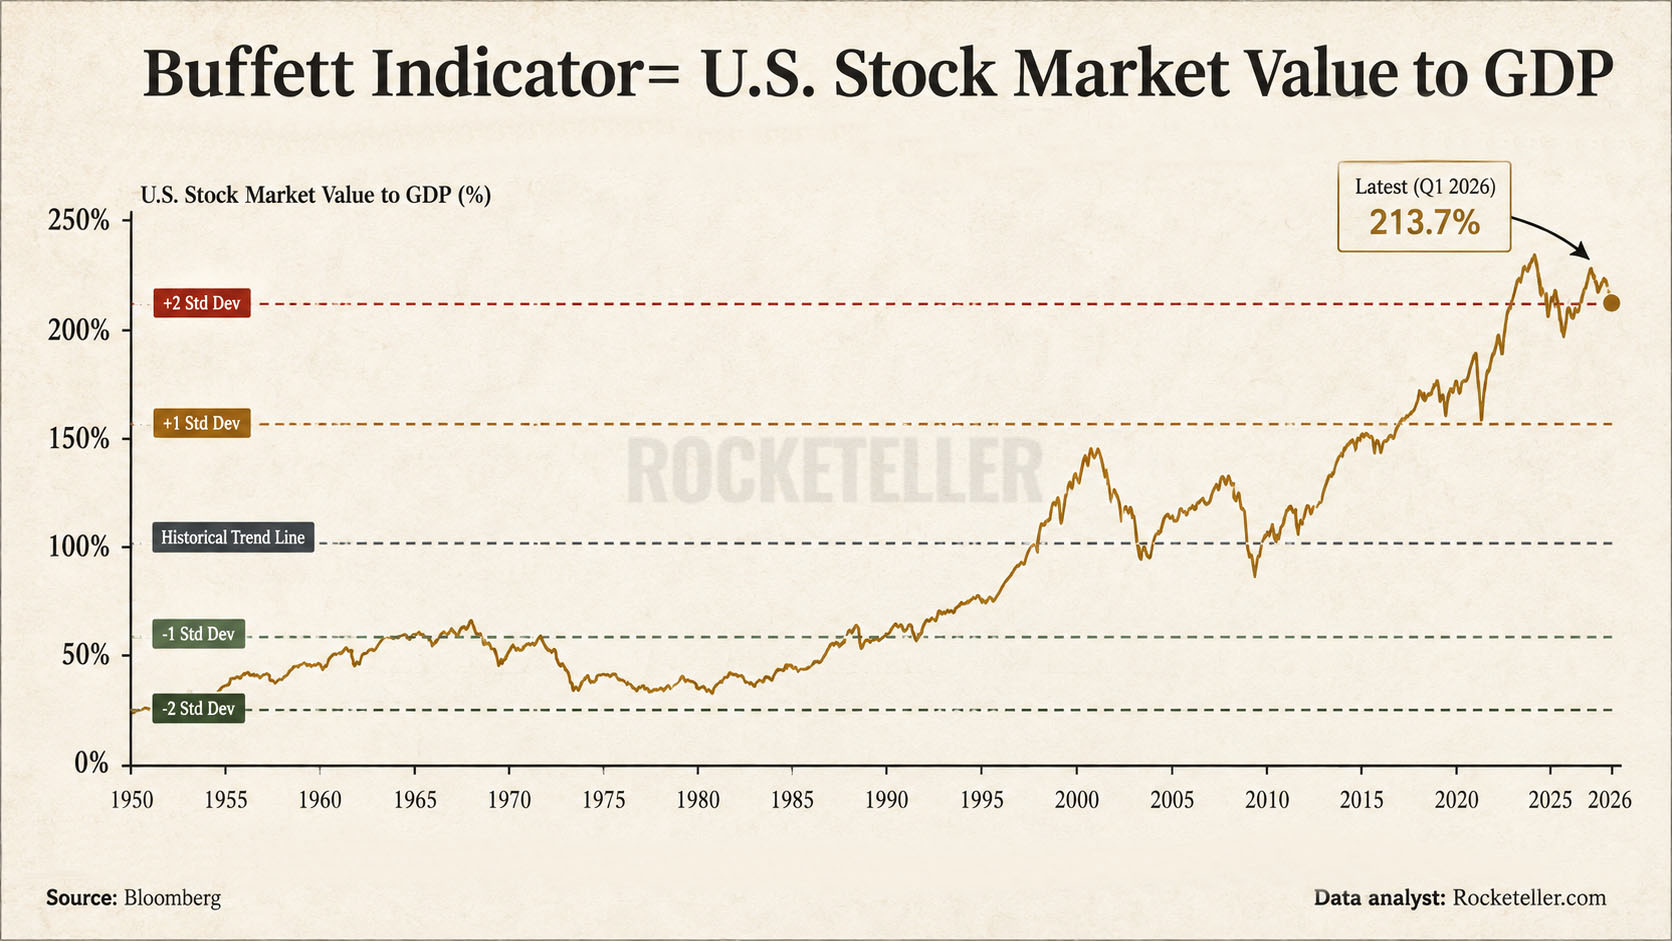
The Buffett Indicator is one of the simplest ways to measure how expensive the U.S. stock market has become. It compares the total value of U.S. equities with the size of the American economy. In this chart, the ratio has climbed to roughly 214%, sitting around the historical plus two standard deviation zone.
In plain English, Wall Street is valued at more than twice the annual output of the U.S. economy. That does not automatically mean stocks crash tomorrow. Expensive markets can stay expensive for years. But it tells us expectations are high, valuations are stretched, and the margin for disappointment is getting thinner.
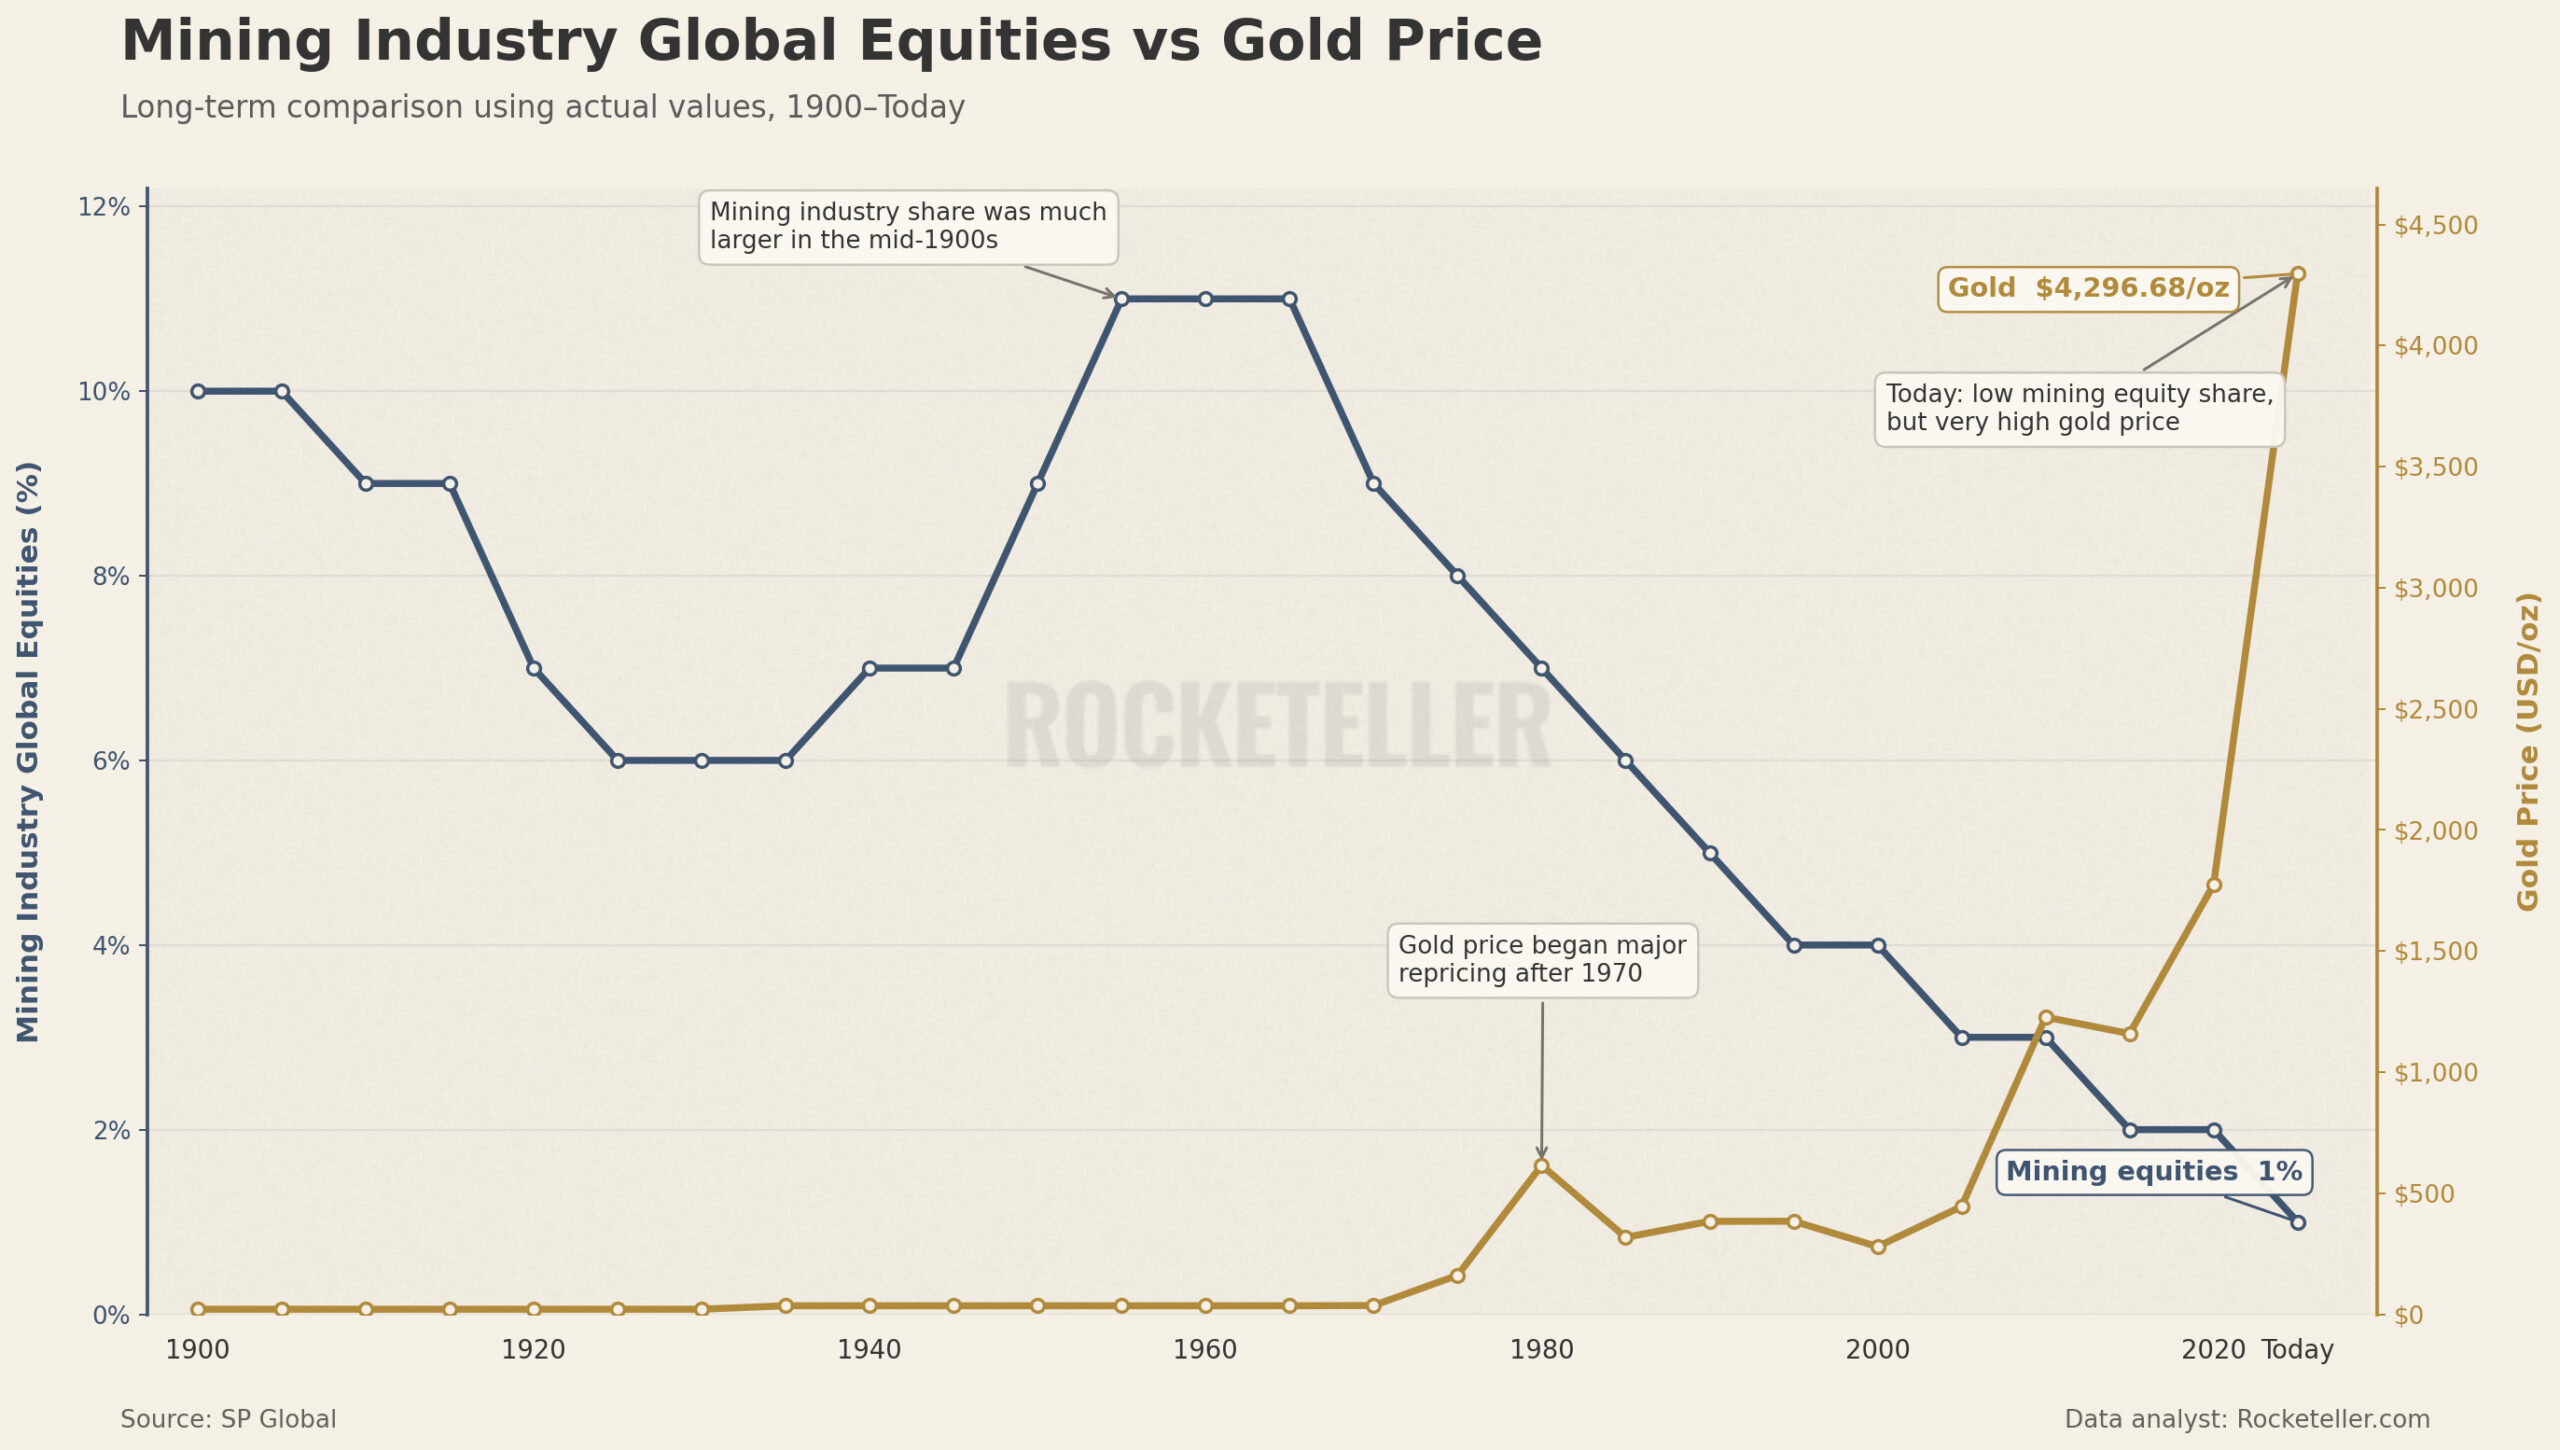
This matters for commodities because capital moves in cycles. When financial assets become extremely expensive, investors eventually start looking elsewhere for better value. If that valuation pressure arrives together with falling interest rates, a weaker U.S. dollar, persistent inflation, or heavy government spending, commodities can become increasingly attractive.
Gold is usually one of the first beneficiaries. It does not need booming economic growth. It mainly needs declining real yields, currency concerns, financial stress, or demand for an alternative store of value. Industrial commodities work differently. Copper, oil, silver, uranium, and other resources perform best when inflationary pressure combines with real demand, infrastructure spending, supply shortages, or economic expansion.
So the Buffett Indicator is not a direct commodity buy signal. Think of it as a warning light on the dashboard. When equity valuations are stretched this far, the relative appeal of scarce real assets can quietly improve. The interesting question is not whether stocks are expensive. It is where the next dollar of capital decides to go.