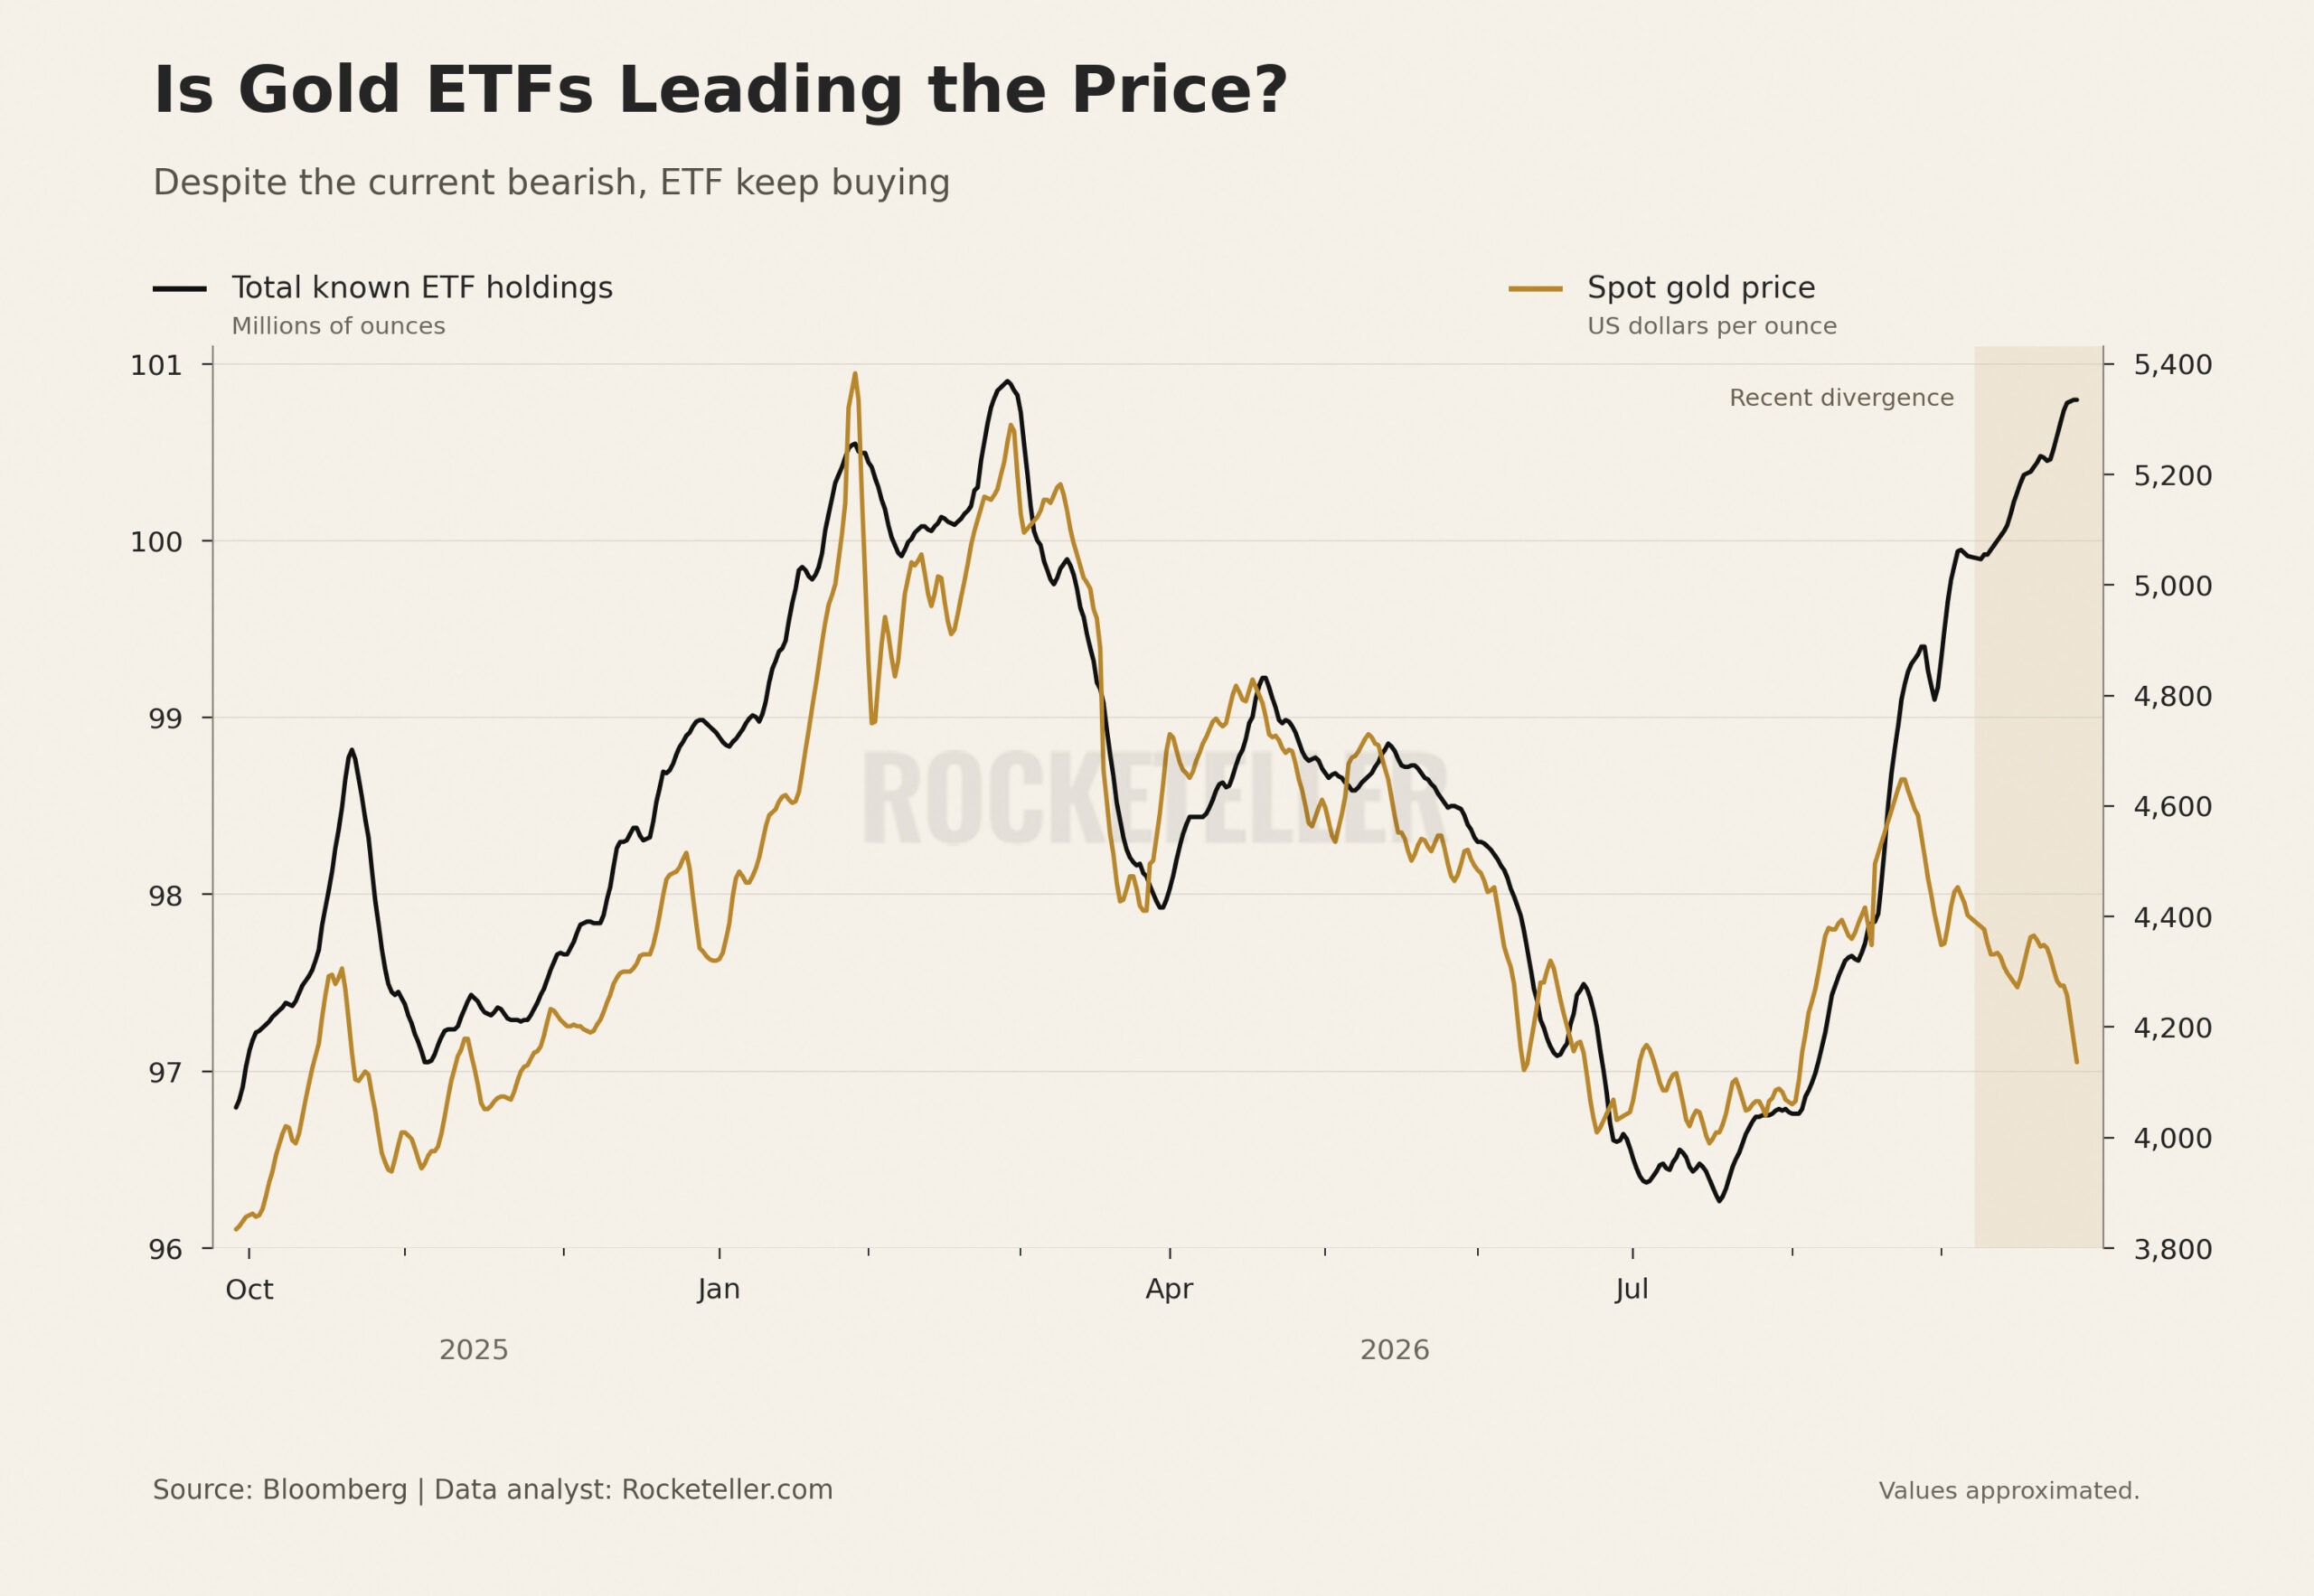
This chart tracks 2 different things. The black line shows total known gold ETF holdings in millions of ounces. The gold line shows spot gold prices in dollars per ounce. Separate scales, same timeline. At the far right, holdings climb while prices retreat. That divergence is the story.
Gold ETFs let investors gain exposure to bullion through funds. Rising holdings suggest investors are adding gold exposure even while the market offers cheaper prices. Think of it as shoppers filling their carts during a sale.
Why can prices fall anyway? ETF demand is only one piece of the market. A stronger dollar, higher real yields, futures selling or profit taking can outweigh buying. Investors may accumulate gold for diversification, geopolitical protection or concerns about currency purchasing power. The chart shows the divergence, which interesting.
Here is where commodities enter the picture. If gold demand reflects expectations of easier monetary policy and a weaker dollar, that backdrop could support silver and other commodities. Silver may benefit from both investment demand and industrial activity.
But if investors are buying protection against slowing growth, gold can strengthen while copper and oil struggle. Factories and transport need demand. Bullion does not need a booming economy to attract buyers. So, are ETFs leading the next rebound? That’s what we believe. Watch the dollar, real yields and growth.