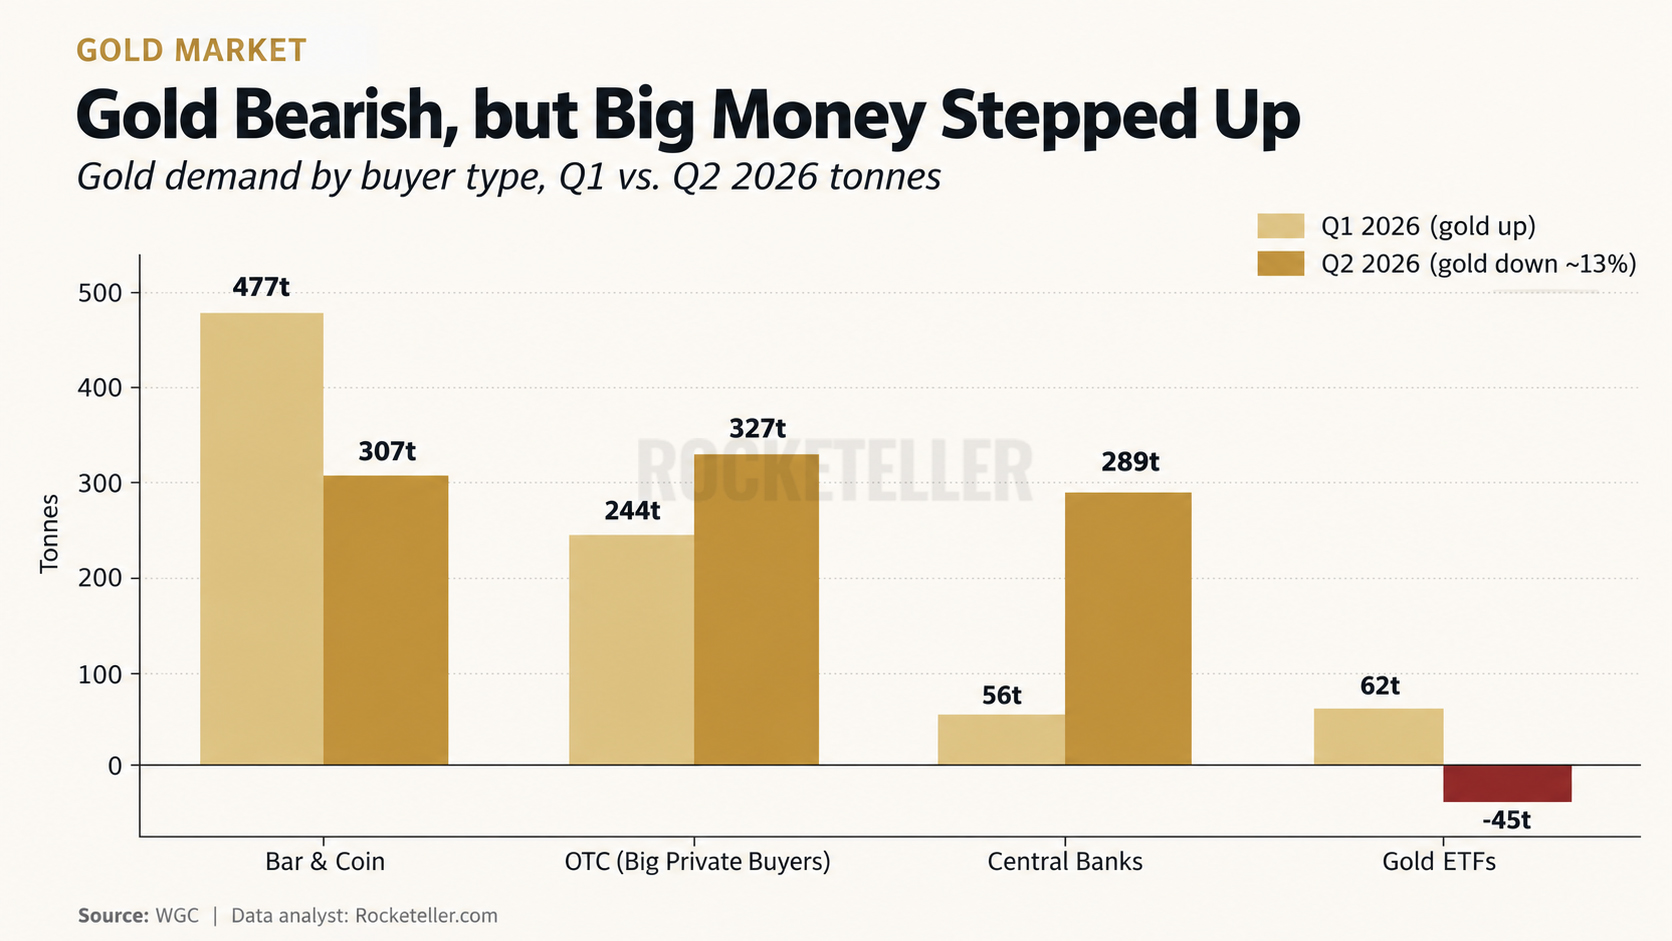
Gold fell, and the obvious trade was to run for the exits. Except some of the biggest buyers did exactly the opposite. In Q2 2026, gold ETFs flipped from buying 62 tonnes
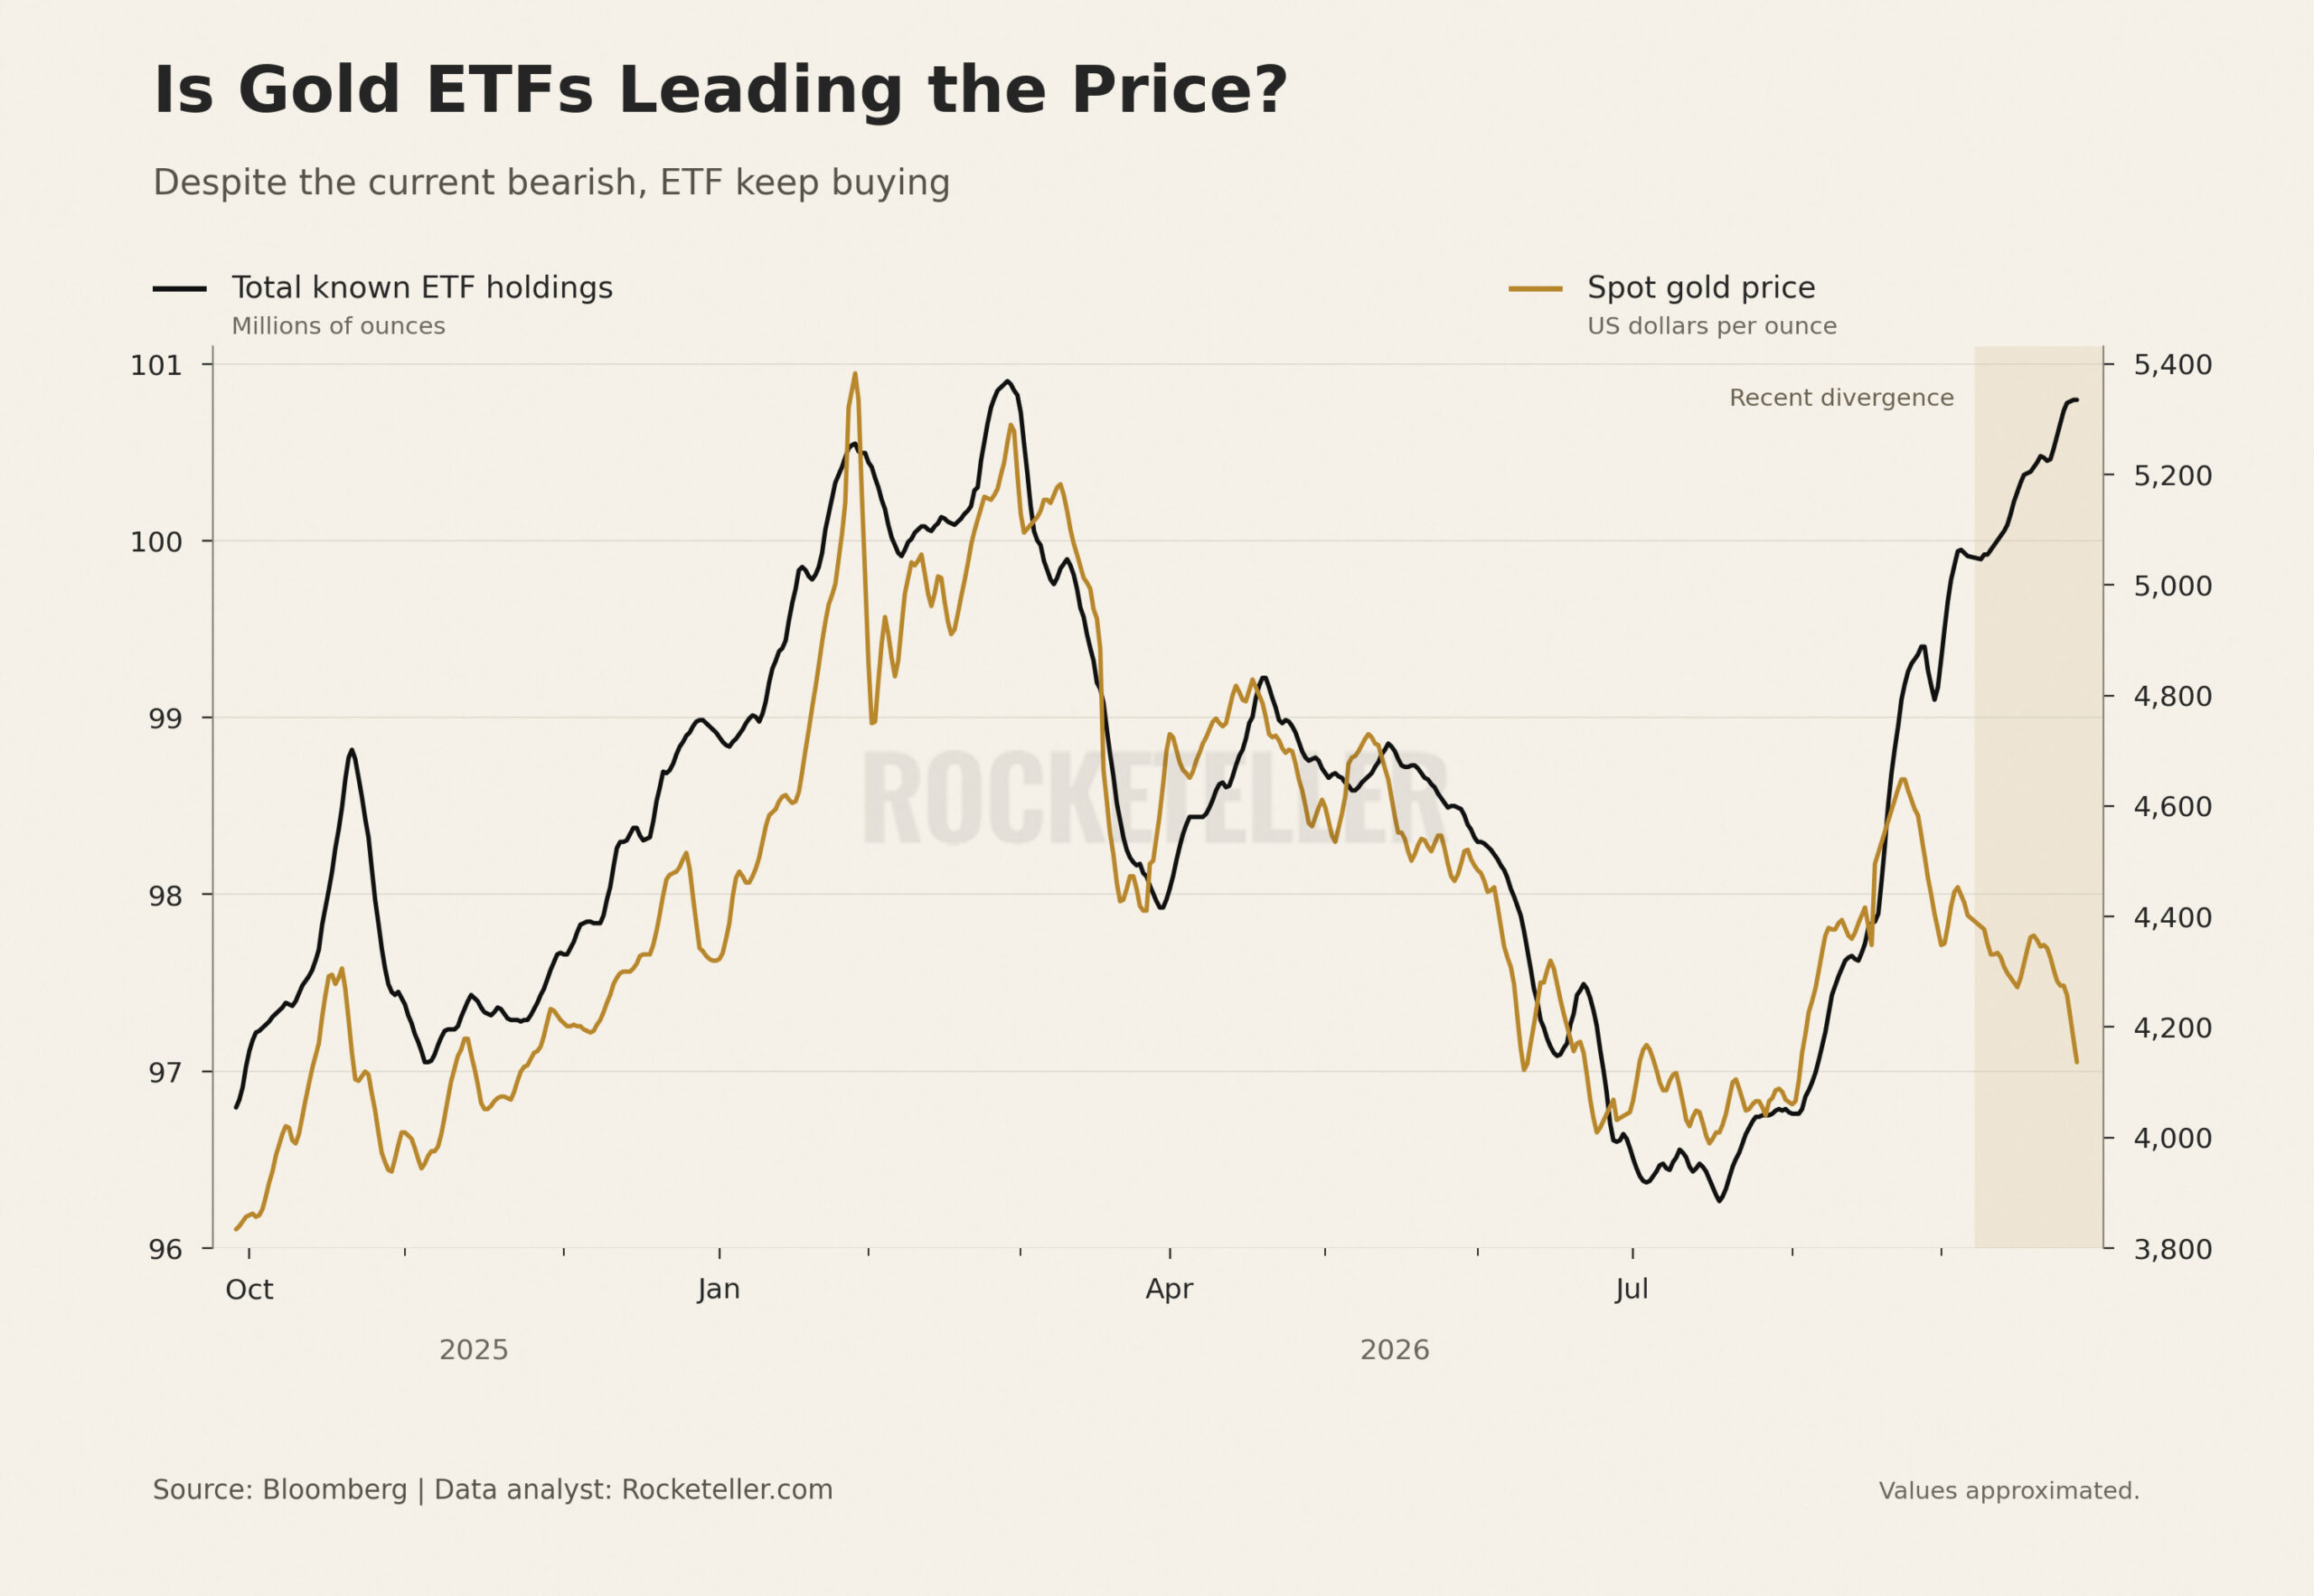
This chart tracks 2 different things. The black line shows total known gold ETF holdings in millions of ounces. The gold line shows spot gold prices in dollars per ounce. Separate scales,
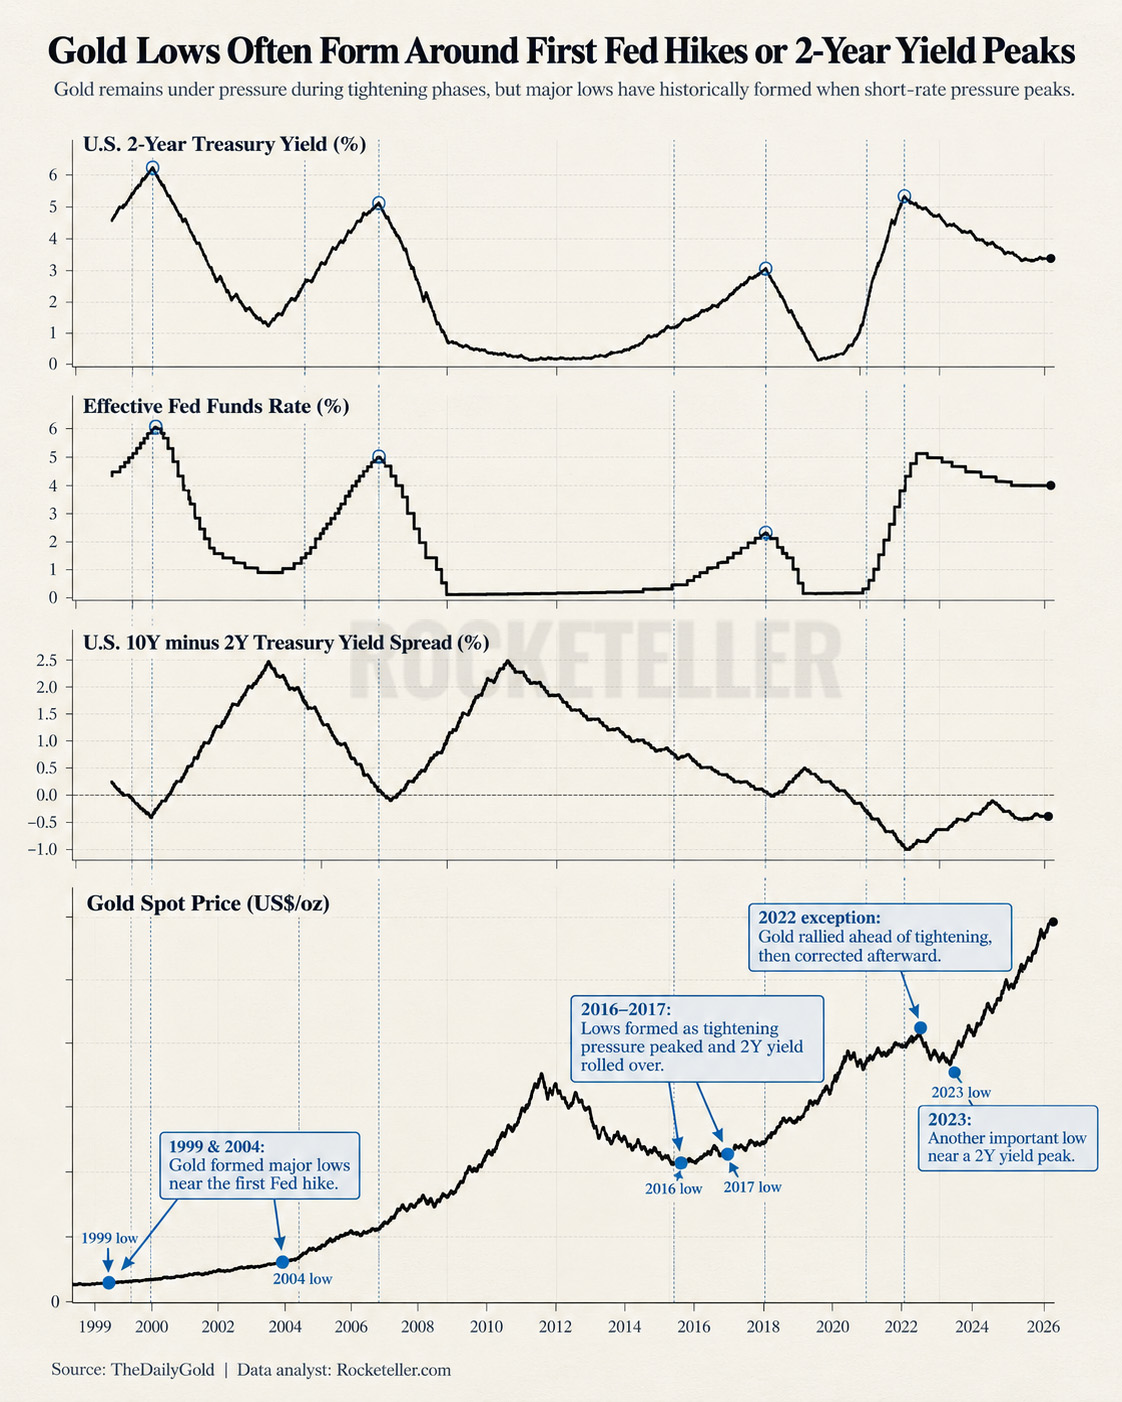
What this chart is really showing is a battle between gold and the price of money. When the Federal Reserve tightens policy, short-term yields rise, real borrowing costs increase, liquidity becomes more
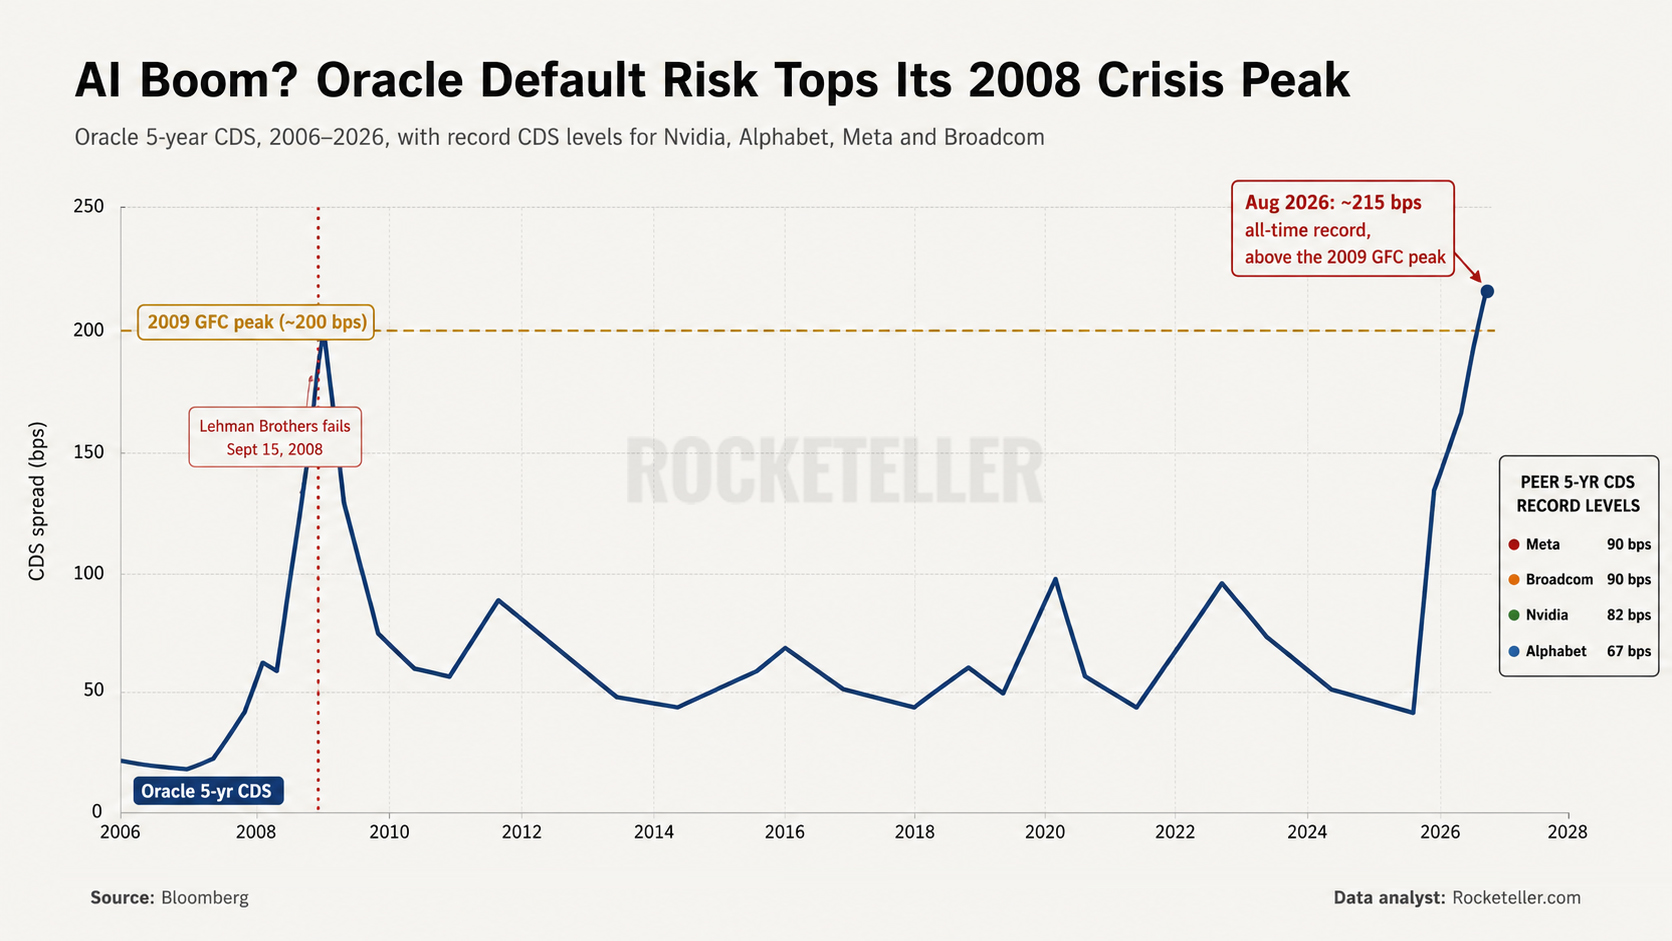
This chart is not really about Oracle. It is about what happens when the AI boom collides with the cost of money. Oracle’s 5-year CDS has surged to around 215 basis points,
This chart is a reminder that even strong bull markets do not move in a straight line. It tracks the major corrections inside the 2001 to 2011 bull market and shows something
This chart takes three secular Gold to Dow cycles and puts them on the same indexed scale, so you can compare them without getting distracted by raw numbers. In other words, it
Our story didn’t start in stocks. It started in the foreign exchange market. The land of flashing screens, fast clicks, and daily combat with price action. We spent nearly a decade there,