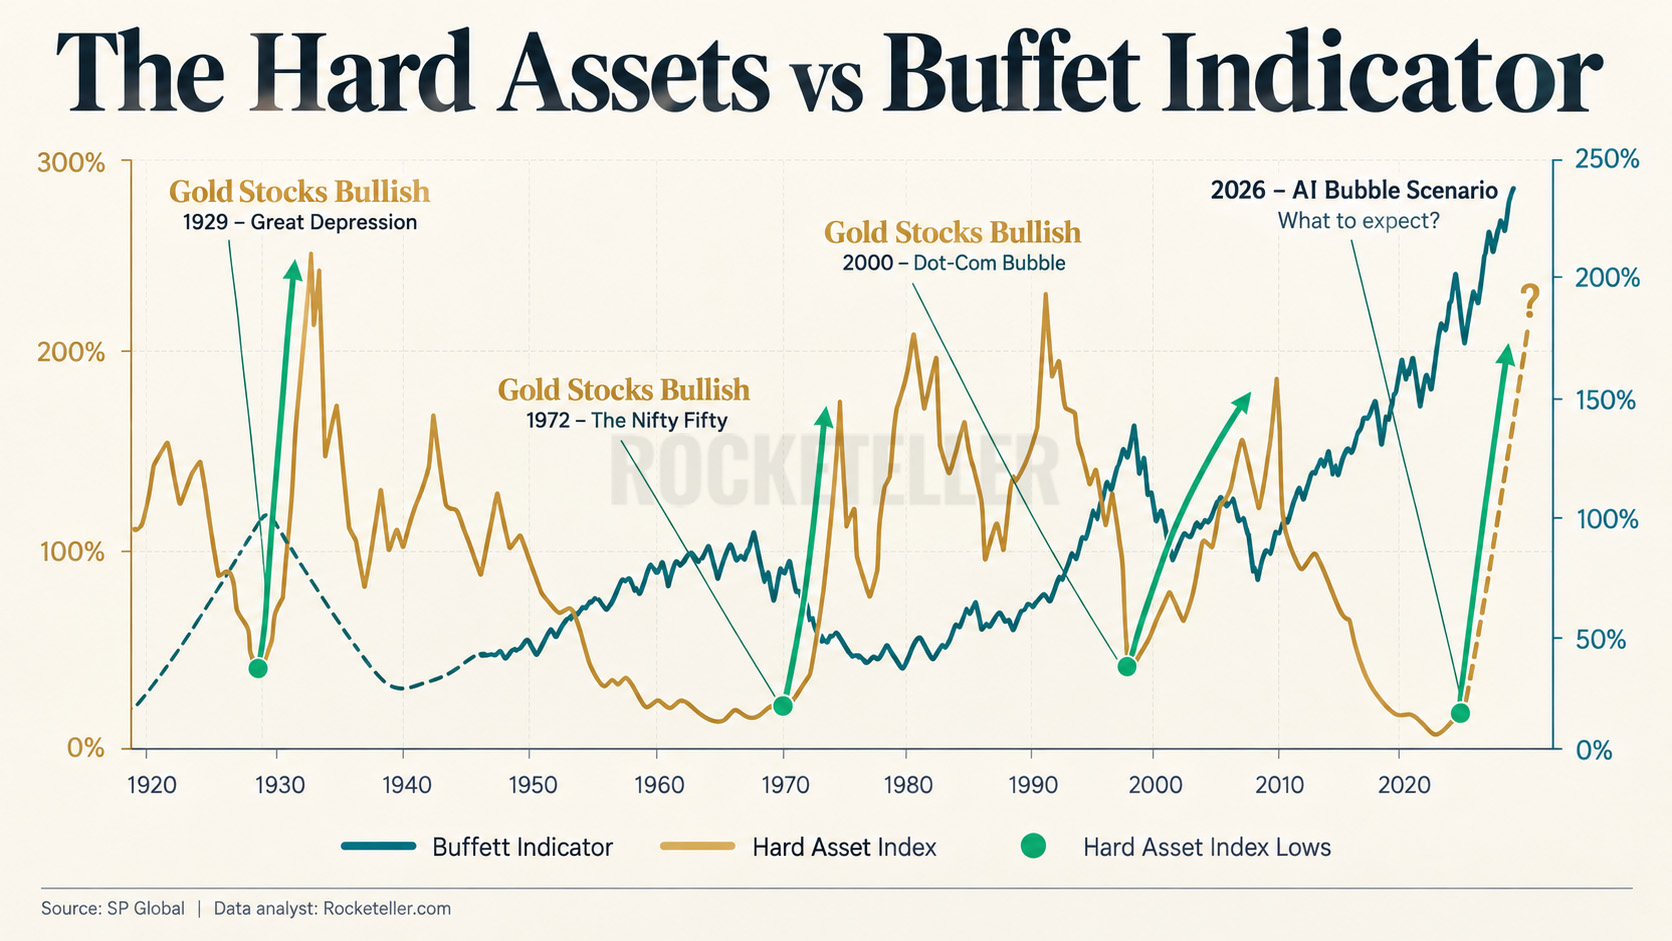
Every market cycle has a favorite investment. The trouble begins when everyone wants to own the same thing at the same price. This chart compares the Buffett Indicator, which measures the value of US stocks relative to the economy, with a historical Hard Asset Index. Its message is simple, when financial assets become crowded and expensive, real assets can eventually have their moment.
Look at the Great Depression. While the broader stock market collapsed, certain gold miners delivered extraordinary returns. Then came the 1970s. The Nifty Fifty era gave way to inflation, a weakening dollar and an explosive run in gold. After the dot-com bubble burst in 2000, another powerful gold cycle began.
Why does this happen? Expensive stocks depend on expectations staying high. When confidence cracks, investors reassess earnings, interest rates and the purchasing power of money. Gold can benefit from falling real yields, currency worries and demand for monetary protection.
Gold miners add another twist. When gold prices rise faster than production costs, profit margins can expand dramatically. That is why mining shares sometimes move much further than the metal itself. But do not confuse gold with every commodity. Copper and oil still depend heavily on industrial demand and can struggle during recessions.
Now the chart raises its biggest question, could enthusiasm around artificial intelligence set up another rotation into hard assets? Possibly. But the 2026 arrow is a scenario, not a forecast. History offers a compelling setup, not a guaranteed repeat. Timing, as always, remains the challenge.