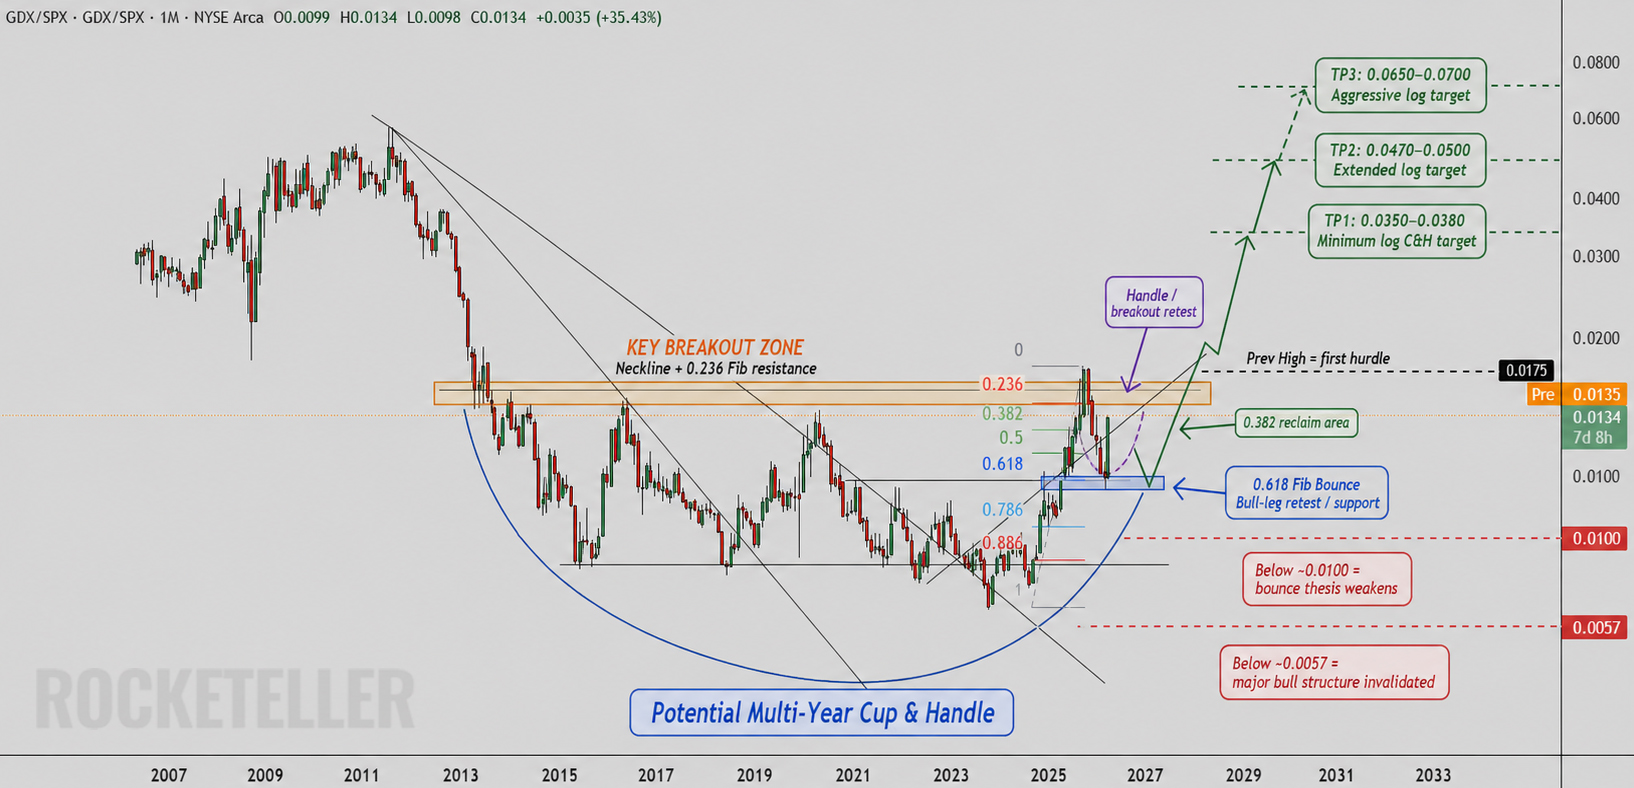
This chart tracks GDX against the S&P 500, measuring the relative strength of gold miners versus the US equity market. The key message is simple, after more than a decade of underperformance, gold miners may be trying to break out of a multi year base.
Technically, the ratio is forming a potential cup and handle. The breakout zone sits around the old neckline, while the recent pullback is testing Fibonacci support near the 0.618 retracement. If buyers defend that zone and the ratio reclaims the 0.382 level, the next battle is the previous high around 0.0175. A clean break above that level would strengthen the case for a larger trend reversal. And that’s what we predicting in coming few months.
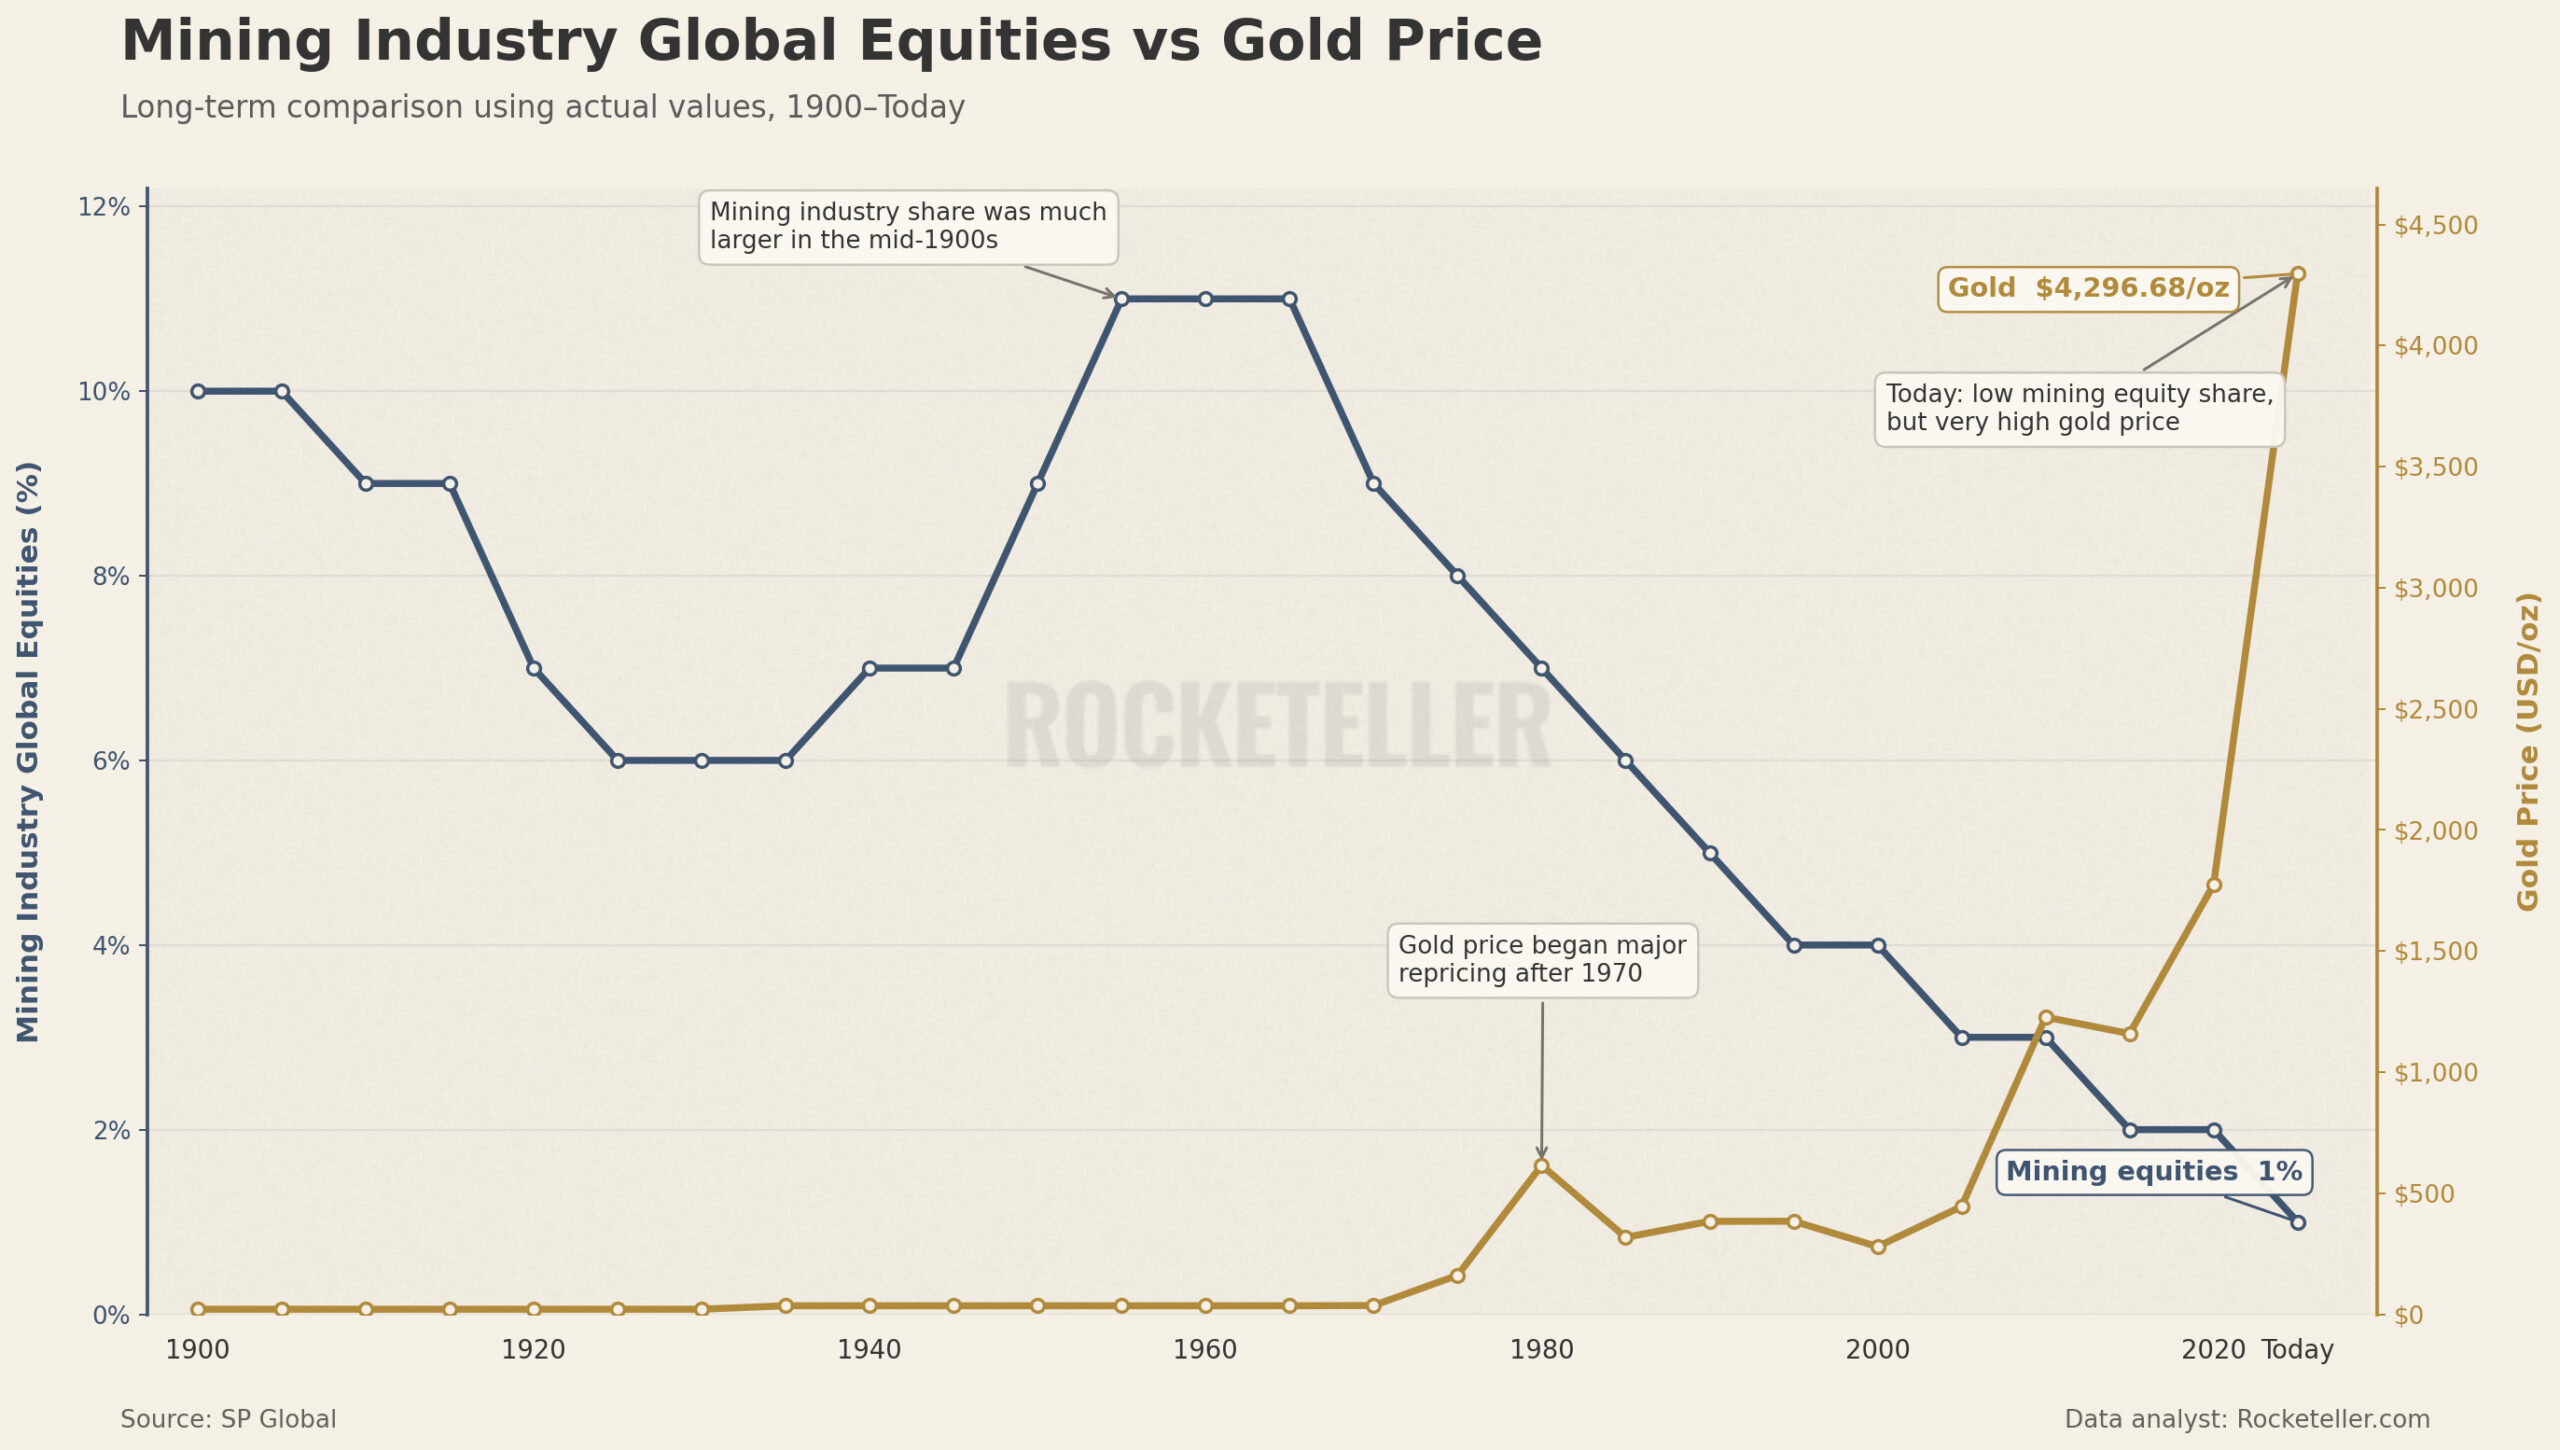
Gold miners respond with leverage to moves in gold. When gold rises faster than operating costs, miner margins can expand, attracting capital into the sector. If GDX begins outperforming the S&P 500, it can signal investors are rotating away from expensive financial assets and toward hard assets, inflation hedges and resource equities.
The macro fuel could come from falling real interest rates, a weaker US dollar, persistent fiscal deficits, sticky inflation or growing demand for monetary hedges. Gold often moves first. Then silver and mining equities will accelerate, followed by broader interest in copper, energy and other real asset themes. This is not merely a gold chart. It may be an early warning that market leadership is changing. If the breakout holds, the commodity cycle could move from background noise to center stage.