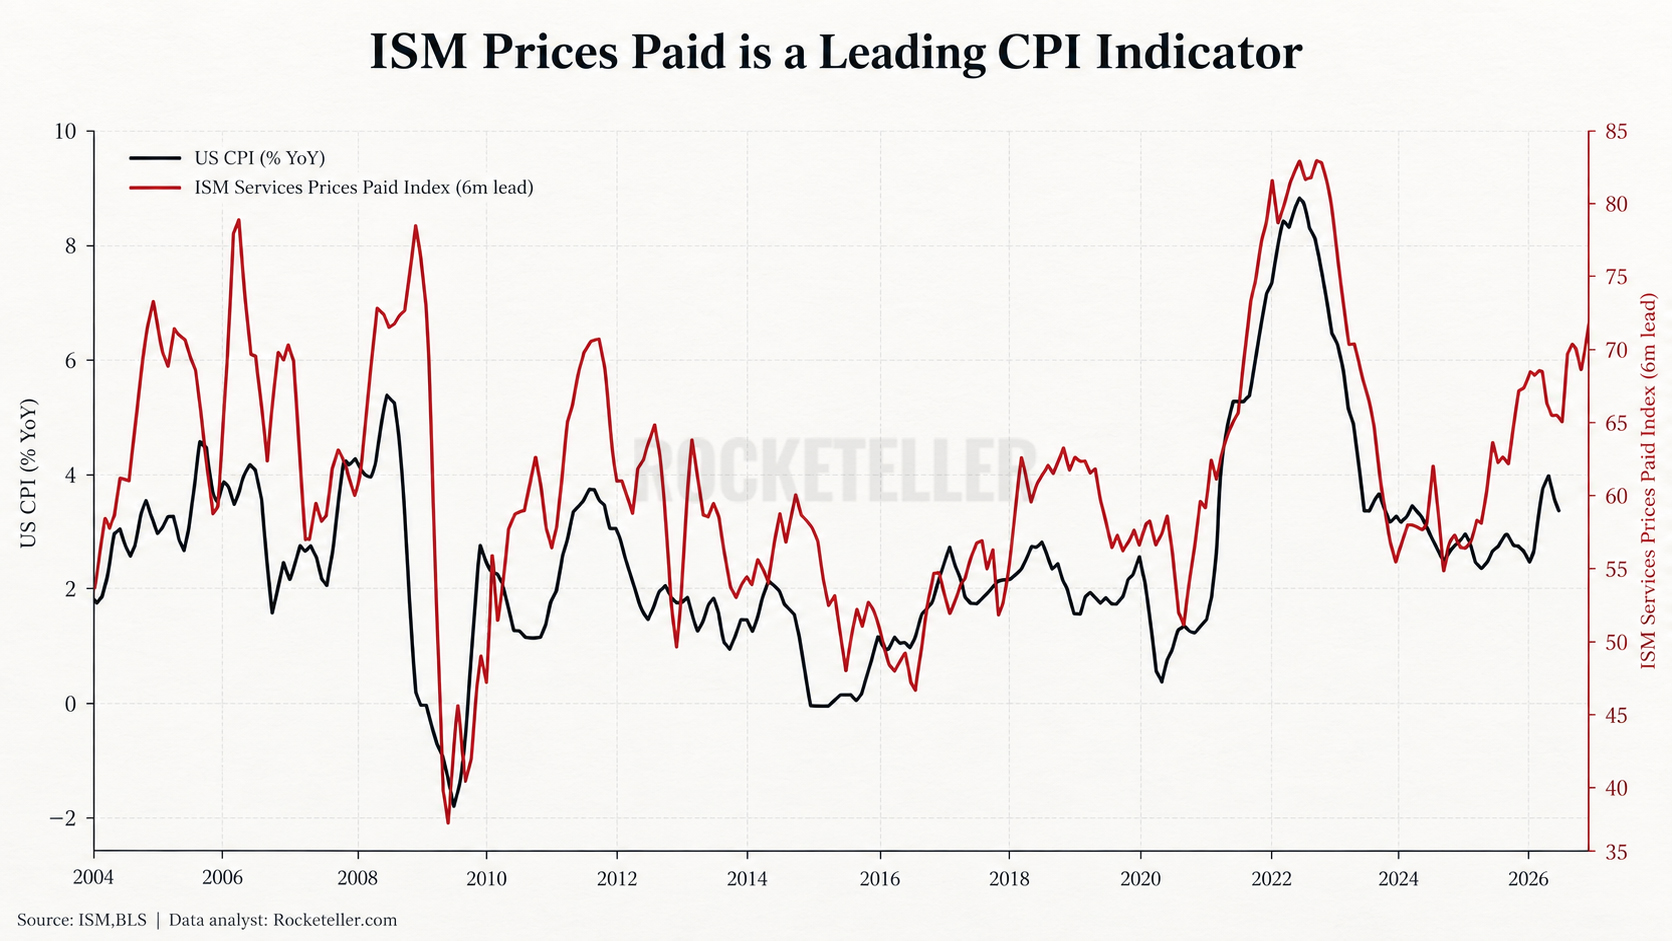
This chart is basically inflation’s smoke detector. The black line shows US CPI, while the red line tracks the ISM Services Prices Paid Index pushed forward by 6 months. In simple terms, ISM is telling us whether businesses are paying more for the things they need to operate. Historically, when those cost pressures start climbing, consumer inflation often shows up several months later.
And right now, the smoke detector is flashing again. CPI has cooled dramatically from the 2022 inflation shock, but ISM Prices Paid is turning higher and moving back toward levels associated with stronger inflation pressure. That does not mean CPI has to copy the red line perfectly. It does mean the disinflation story could become much harder from here. Companies facing rising costs eventually have three choices. Absorb the pain, cut costs somewhere else, or raise prices. When enough businesses choose the third option, CPI starts feeling the heat.
For commodities, ISM Prices Paid is not purely a commodity indicator because it also captures other business costs. But when rising prices come from stronger demand, supply constraints and broader reflation, commodities often sit near the front of that inflation pipeline. Energy, copper and other industrial materials can benefit as demand and replacement costs rise.
Gold and silver are slightly different animals. Persistent inflation can strengthen the monetary case for precious metals, particularly when real interest rates fall and the dollar weakens. The complication comes if inflation forces the Federal Reserve to stay restrictive, pushing real yields higher.