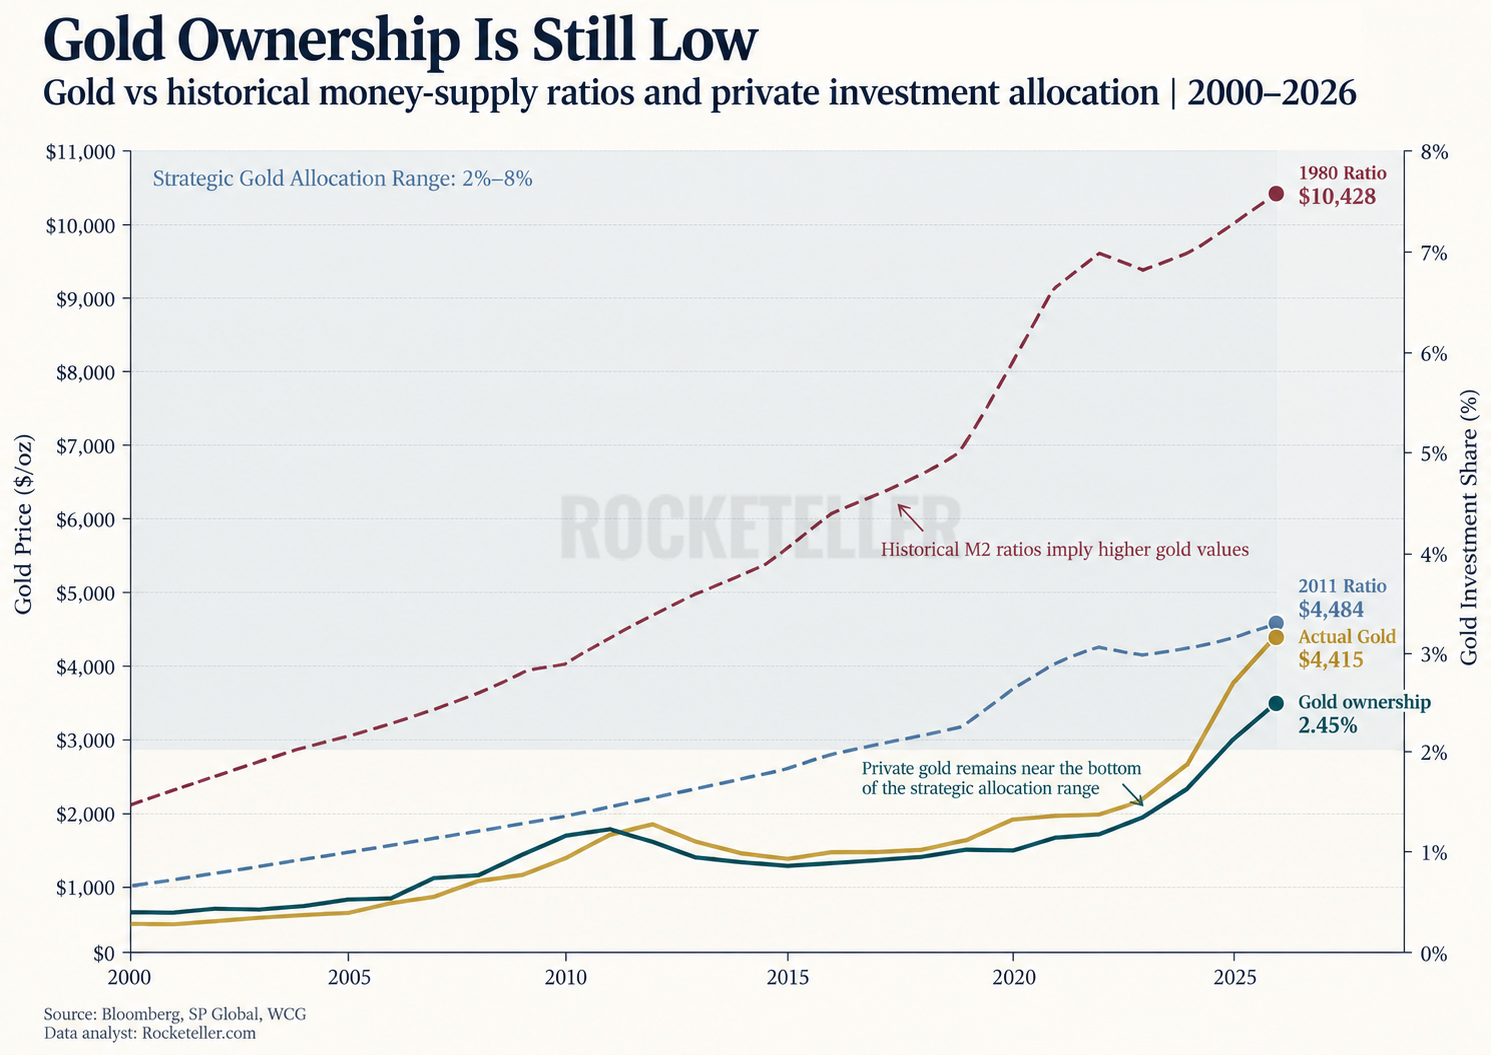
This chart tells a surprisingly simple story. Gold has already exploded higher in price, but private investors still barely own it. That is the stronger story. The key is not simply that gold allocation is near the bottom of the 2 to 8% strategic range. It is that private gold ownership today is dramatically below the levels investors were willing to hold during the great gold cycle of the early 1980s.
Gold is already trading around 4,415 dollars an ounce, yet private investment gold represents only about 2.45% of the combined value of global equities and bonds. Now compare that with history. In 1980, the allocation was roughly 6.3%. By 1981, it was around 7.3%.
That changes the entire interpretation of this chart. Price has exploded. Ownership has not.
Today’s private allocation is barely one third of the 1981 level. So despite record nominal gold prices, this does not resemble the kind of crowded positioning associated with the previous great precious metals mania.
The money supply tells a similar story. Gold has roughly caught up with its 2011 relationship to M2, but it remains far below the 1980 relationship. Applying that 1980 ratio to today’s money supply produces a gold value around $10,428/oz. In that sense, gold may be expensive in dollars, but still historically undervalued against the amount of money that now exists.
And this is where the commodity cycle becomes interesting. If private investors begin rebuilding gold allocations from 2.45 toward 4, 5 or even 6%, the capital involved could be enormous. That demand would not necessarily stop with bullion. As gold becomes more established as a portfolio allocation, investors may increasingly search for leverage to the same hard asset theme through silver, mining equities, copper, energy and broader commodities.