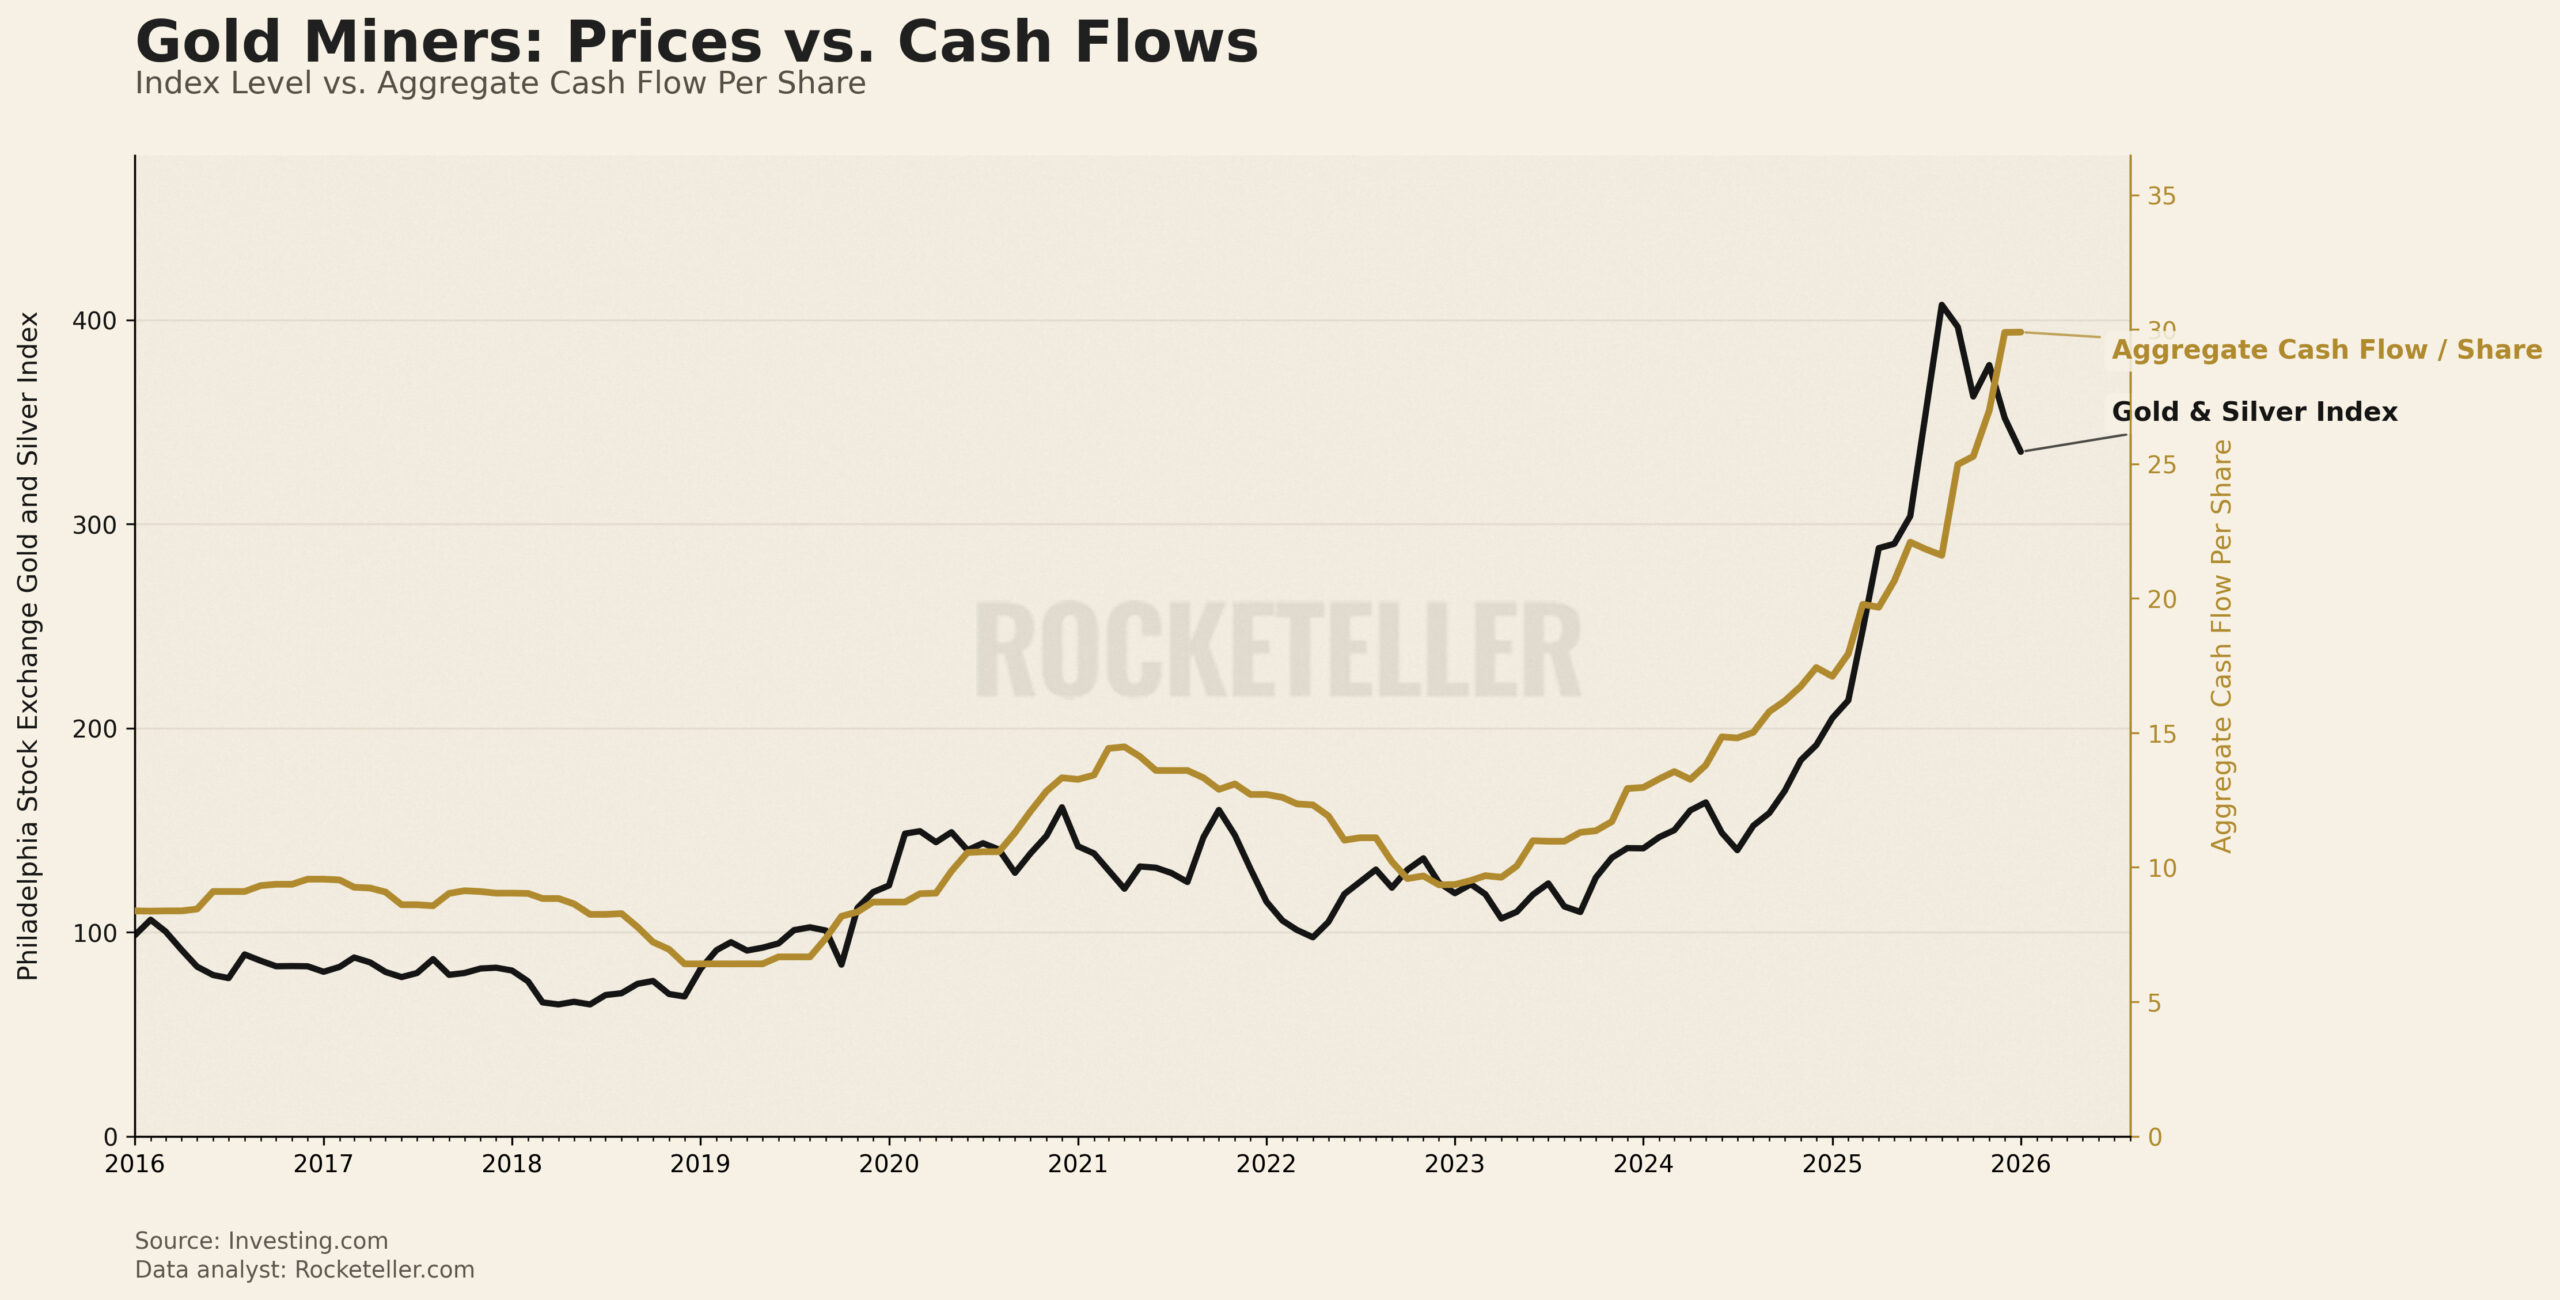
The chart tracks the Philadelphia Gold and Silver Index against the aggregate cash flow per share generated by the major gold and silver miners. One line is pure price action of the sector. The other is the actual cash these companies are throwing off after costs. From 2016 through early 2024 the two lines mostly drifted in the same neighborhood. Cash flow hovered between $7 and $15 a share. The index stayed mostly range-bound below 160. Then the script flipped.
Gold itself began a powerful multi-year climb. Higher realized prices hit the miners’ income statements with almost pure leverage. Fixed costs stayed relatively steady while revenue soared, so free cash flow per share exploded past $20, then $30. The stock index followed with a lag, ripping from the mid-100s to over 400 in a matter of months. By mid-2026 the cash-flow line is still sitting near its peak while the index has pulled back a touch. That small divergence is the market catching its breath after an historic re-rating.
Cause and effect run straight through the commodity complex. Strong gold prices deliver outsized cash generation to the producers. That cash validates the bull market in the metal itself, attracts capital into the sector, and eventually funds more exploration and production. For now the feedback loop remains bullish, elevated cash flows prove the gold price is not a fleeting spike but a durable new regime. Until supply responds in size, the same force that lifted miner cash flows keeps pressure under the entire precious-metals complex.